
Barrington Park by Broadmoor
3634 Glen Oaks Blvd,
Sioux City, IA 51104
$985 - $1,735
1-2 Beds


Nestled along the Missouri River where Iowa, Nebraska, and South Dakota converge, Sioux City combines historical heritage with modern amenities. The downtown area features the Sioux City Art Center, which showcases works by regional and national artists, and the restored Orpheum Theatre. Stone State Park offers hiking trails through the distinctive Loess Hills, while the Missouri Riverfront area provides recreational spaces, including the Anderson Dance Pavilion and Lewis and Clark Interpretive Center.
Housing options in Sioux City remain relatively affordable, with current average rents ranging from $811 for studios to $1,375 for three-bedroom units, showing modest year-over-year increases between 1-8%. The rental market includes various housing styles across different neighborhoods, from downtown apartments to suburban communities. The Morningside neighborhood features tree-lined streets near Morningside University, while the Historic Fourth Street District offers loft apartments in restored buildings. Several higher education institutions call Sioux City home, including Briar Cliff University and Western Iowa Tech Community College. The city's history as a river port earned it the nickname "Little Chicago" during the Prohibition era, and today it maintains its distinctive character while continuing to develop.
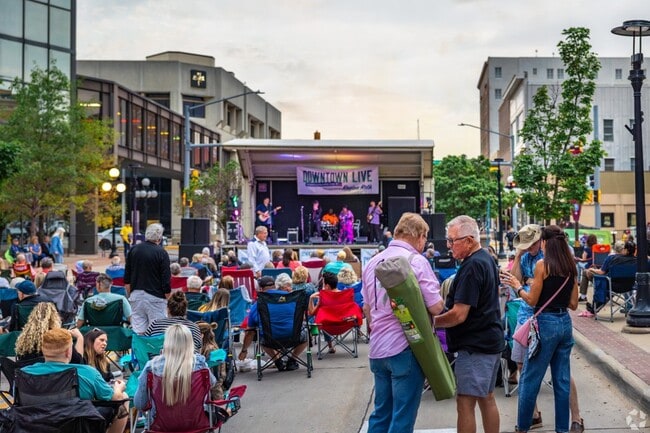
Catch up with neighbors at events in Sioux City.
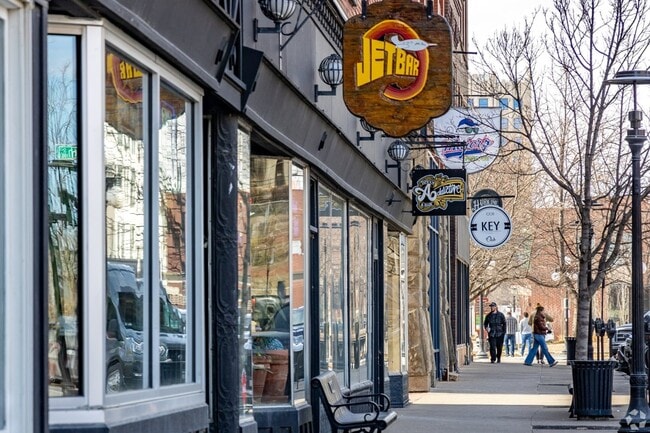
Downtown Sioux City is full of life regardless of the day or time.
Stone State Park is a favorite place of residents to enjoy nature.
As of April 2026, the average apartment rent in Sioux City, IA is $818 for a studio, $960 for one bedroom, $1,172 for two bedrooms, and $1,371 for three bedrooms. Apartment rent in Sioux City has increased by 0.4% in the past year.
The cost of living in Sioux City, IA is 13.9% lower than the national average. Generally, housing in Sioux City is 30.2% less expensive than the national average, with rent falling between $818 - $1,371. You can expect to pay 0.8% less for groceries, 15.5% less for utilities, and 5.8% less for transportation.
Explore how walkable, bikeable, drivable, and transit-friendly Sioux City, IA is for everyday living.
Somewhat Walkable
Walkability
Minimal Public Transit
Transit
Exceptionally Drivable
Drivability
Moderately Bikeable
Bikeability
Public
Grades K-5
262 Students

Public
Grades K-5
671 Students

Public
Grades PK-5
652 Students

Public
Grades PK-5
606 Students
Public
Grades PK-5
589 Students
Public
Grades 6-8
1,067 Students

Public
Grades 6-8
1,224 Students
Public
Grades 6-8
864 Students
Public
Grades 9-12
1,634 Students

Public
Grades 9-12
1,495 Students
Public
Grades 9-12
1,252 Students


317
Communities
77,315
Units
145
Cities

72
Communities
15,926
Units
34
Cities

52
Communities
5,540
Units
27
Cities

53
Communities
6,543
Units
35
Cities

68
Communities
9,649
Units
13
Cities

25
Communities
6,531
Units
9
Cities
† Our analysis of utilities, groceries, transportation, healthcare, home prices, and other goods and services is sourced from the Cost of Living Index, a respected benchmark published by the Council for Community and Economic Research (C2ER) that provides a thorough overview of living expenses across different regions.
Rent data is provided by CoStar Group’s Market Trend reports. As the industry leader in commercial real estate information, analytics, and news, CoStar conducts extensive research to produce and maintain a comprehensive database of commercial real estate information. We combine this data with public record to provide the most up-to-date rental information available.
Consumer goods, services, and home prices are sourced from the Cost of Living Index published by the Council for Community and Economic Research (C2ER). The data on this page is updated quarterly. It was last published in February 2026.
Demographic information comes from Neustar and combines detailed address data with U.S. Census and American Community Survey statistics to produce reliable local estimates.
")


