Median Age
40 Years
Largest Age Group
50-59 Years
Approximately 14% of Residents
Under 20
23%
Over 65
16%


Avg Rent
$1,076
Population
14,931
Renter Mix
41% Rent
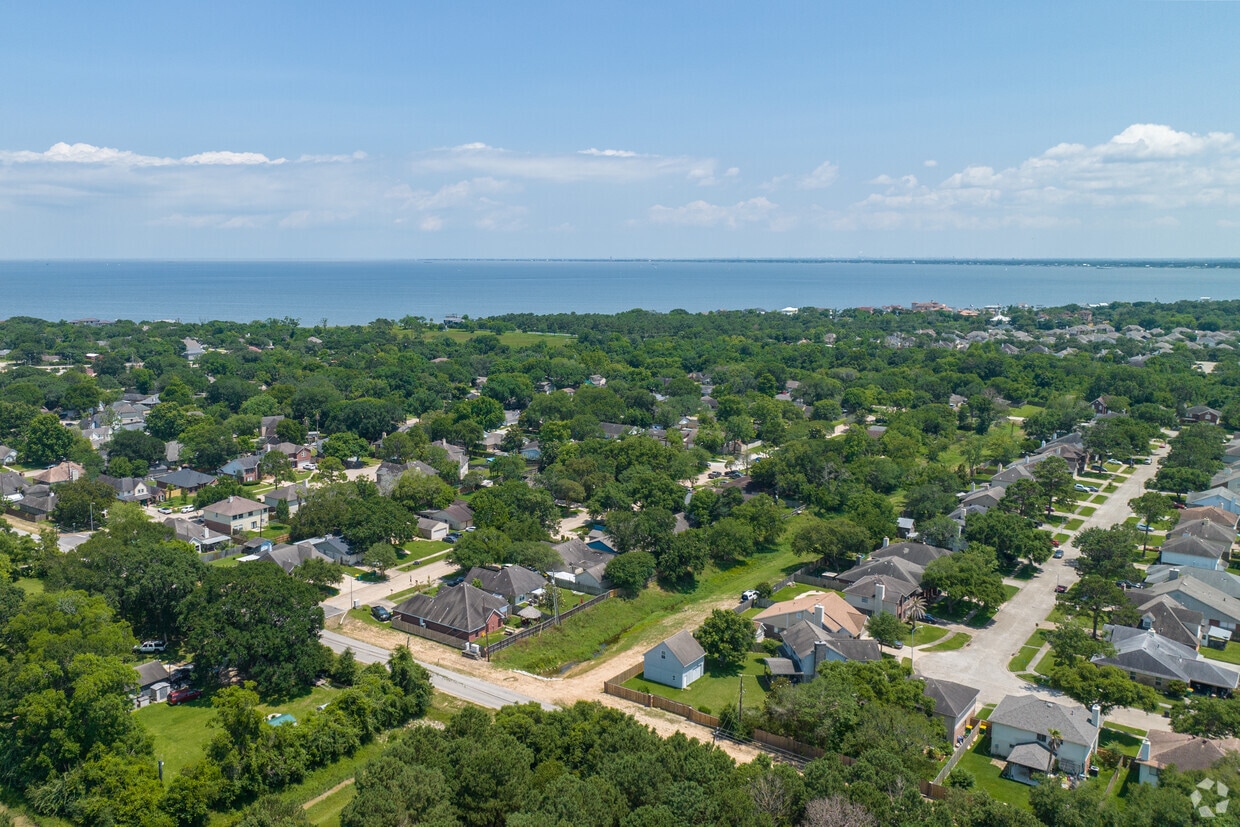
In Seabrook, Texas, residents get the best of both worlds: cozy small-town neighborhoods and easy access to big-city attractions in nearby Houston.
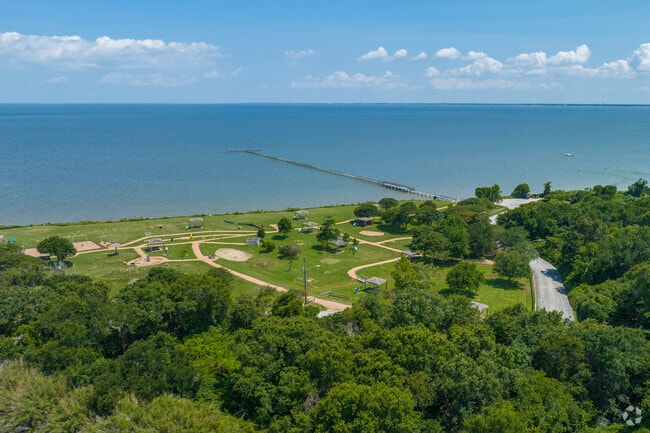
On the northeast end of Seabrook, Pine Gully Park has a fishing pier on Galveston Bay plus nature trails. Try out your fishing rod at the park, or consider joining the Lakewood Yacht Club off of Clear Lake for sailing/boating activities, fine/casual dining, and simply unwind on the bay after a long day.
Seabrook is famous for its seafood dining options. Pier 8 Seafood is a dual-level seafood joint that offers buffet on one level and classic seafood options on the other. If an easygoing, waterside hangout with beautiful water views, gourmet burgers, and classic seafood dishes sounds good to you, then you have to try Outriggers Seafood. Highly-rated Tookie’s Seafood is always a great option, with its large, beachy atmosphere and hearty seafood specialties. There are endless options on the coast once you find your apartment in Seabrook.
Keels and Wheels is dedicated to the preservation and recognition of antique vehicles and boats.
The Kemah Boardwalk is a waterfront entertainment district near Seabrook, TX.
A variety of vessels traverse the Seabrook marina daily.
A walk on the walking path in Seabrook Wildlife Park is a peaceful way to see wildlife and enjoy the beauty of nature.
Mansions on the coast in Seabrook, TX are luxurious homes with stunning views of the Gulf of Mexico.
Pine Gully Park is a 52-acre park with a fishing pier, playground, picnic area, and hiking trails.
Median Household Income
$91,068
Average: $125,126
Education
4,612
Residents Have a Degree
Job Market
8,146
Workers Employed
Median Age
40 Years
Largest Age Group
50-59 Years
Approximately 14% of Residents
Under 20
23%
Over 65
16%
Housing Distribution
Seabrook has more homeowners than renters.

Education Distribution
Review this city's overall education levels.

As of July 2026, the average apartment rent in Seabrook, TX is $854 for a studio, $1,076 for one bedroom, $1,422 for two bedrooms, and $2,194 for three bedrooms. Apartment rent in Seabrook has increased by 0.2% in the past year.
Explore how walkable, bikeable, drivable, and transit-friendly Seabrook, TX is for everyday living.
Fairly Walkable
Walkability
Exceptionally Drivable
Drivability
Fairly Bikeable
Bikeability
Public
Grades PK-5
516 Students

Public
Grades 6-8
963 Students
† Our analysis of utilities, groceries, transportation, healthcare, home prices, and other goods and services is sourced from the Cost of Living Index, a respected benchmark published by the Council for Community and Economic Research (C2ER) that provides a thorough overview of living expenses across different regions.
Rent data is provided by CoStar Group’s Market Trend reports. As the industry leader in commercial real estate information, analytics, and news, CoStar conducts extensive research to produce and maintain a comprehensive database of commercial real estate information. We combine this data with public record to provide the most up-to-date rental information available.
Consumer goods, services, and home prices are sourced from the Cost of Living Index published by the Council for Community and Economic Research (C2ER). The data on this page is updated quarterly. It was last published in June 2026.
Demographic information comes from Neustar and combines detailed address data with U.S. Census and American Community Survey statistics to produce reliable local estimates.


