Median Age
36 Years
Largest Age Group
20-29 Years
Approximately 15% of Residents
Under 20
26%
Over 65
17%


Avg Rent
$995
Population
99,038
Renter Mix
41% Rent
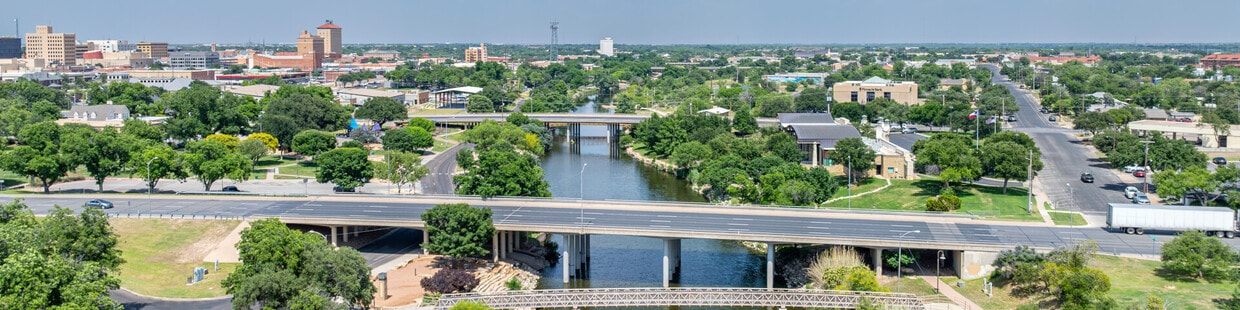
San Angelo, Texas combines small-town hospitality with cultural attractions along the Concho River. Home to nearly 100,000 residents, the city centers around Angelo State University and Fort Concho National Historic Landmark. The downtown district houses the San Angelo Museum of Fine Arts and San Angelo Performing Arts Center, while the river walk offers paths for walking, running, and cycling. Current rental rates remain competitive, with one-bedroom apartments averaging $942 monthly, representing a 2.5% annual increase, while two-bedroom units typically cost around $1,109.
The city features several outdoor attractions, including San Angelo State Park, which maintains part of the official Texas Longhorn herd, and the International Water Lily Collection at Civic League Park. Established neighborhoods include Santa Rita, with its historic architecture, and the Lake Nasworthy area near the reservoir. Goodfellow Air Force Base serves as a major employer, and the San Angelo Stock Show and Rodeo showcases the area's ranching traditions. Housing options range from downtown apartments in restored buildings to residential communities in the southwest area near Loop 306.
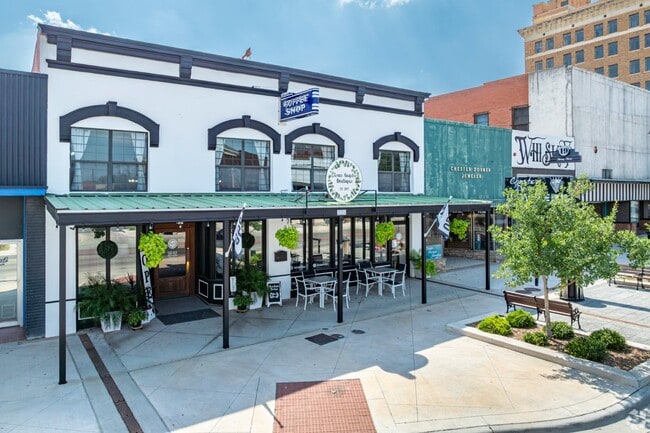
Historic Downtown is filled with local shops, cafes, and restuarants.
The Downtown River Trail is a popular place to take in the sights.
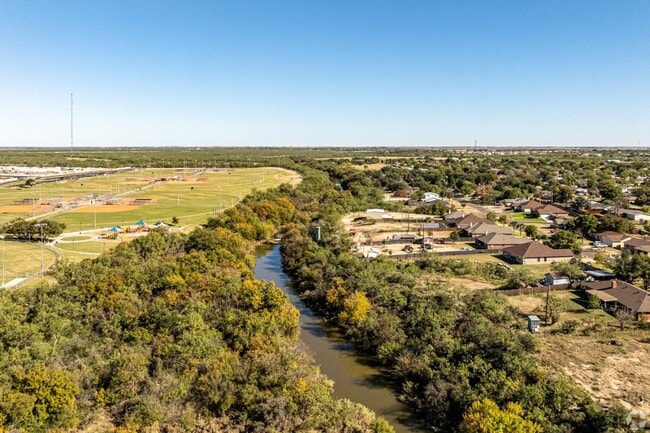
There are plenty of suburbs to choose from in San Angelo.
Median Household Income
$61,122
Average: $71,398
Education
21,162
Residents Have a Degree
Job Market
48,497
Workers Employed
Median Age
36 Years
Largest Age Group
20-29 Years
Approximately 15% of Residents
Under 20
26%
Over 65
17%
Housing Distribution
San Angelo has more homeowners than renters.

Education Distribution
Review this city's overall education levels.

As of July 2026, the average apartment rent in San Angelo, TX is $830 for a studio, $995 for one bedroom, $1,159 for two bedrooms, and $1,443 for three bedrooms. Apartment rent in San Angelo has increased by 3.3% in the past year.
The cost of living in San Angelo, TX is 1.8% lower than the national average. Generally, housing in San Angelo is 3.4% less expensive than the national average, with rent falling between $830 - $1,443. You can expect to pay 5.5% less for groceries, 9.5% more for utilities, and 0.5% more for transportation.
Compare Cities
Explore how walkable, bikeable, drivable, and transit-friendly San Angelo, TX is for everyday living.
Fairly Walkable
Walkability
Exceptionally Drivable
Drivability
Fairly Bikeable
Bikeability
Public
Grades K-5
447 Students

Public
Grades K-5
357 Students

Public
Grades PK-5
431 Students

Public
Grades PK-5
243 Students
Texas Leadership of San Angelo
Public
Grades K-12
1,490 Students

Public
Grades 6-8
1,258 Students

Texas Leadership of San Angelo
Public
Grades K-12
1,490 Students
Public
Grades 6-8
1,258 Students
Public
Grades 6-8
903 Students
Public
Grades 6-8
903 Students
Texas Leadership of San Angelo
Public
Grades K-12
1,490 Students
Public
Grades 9-12
334 Students
Public
Grades 9-12
3,065 Students

Premier High School - San Angelo
Public
Grades 9-12
154 Students
Public
Grades 9-12
1,085 Students

† Our analysis of utilities, groceries, transportation, healthcare, home prices, and other goods and services is sourced from the Cost of Living Index, a respected benchmark published by the Council for Community and Economic Research (C2ER) that provides a thorough overview of living expenses across different regions.
Rent data is provided by CoStar Group’s Market Trend reports. As the industry leader in commercial real estate information, analytics, and news, CoStar conducts extensive research to produce and maintain a comprehensive database of commercial real estate information. We combine this data with public record to provide the most up-to-date rental information available.
Consumer goods, services, and home prices are sourced from the Cost of Living Index published by the Council for Community and Economic Research (C2ER). The data on this page is updated quarterly. It was last published in June 2026.
Demographic information comes from Neustar and combines detailed address data with U.S. Census and American Community Survey statistics to produce reliable local estimates.


