Median Age
39 Years
Largest Age Group
30-39 Years
Approximately 21% of Residents
Under 20
18%
Over 65
17%


Avg Rent
$1,385
Population
58,141
Renter Mix
33% Rent
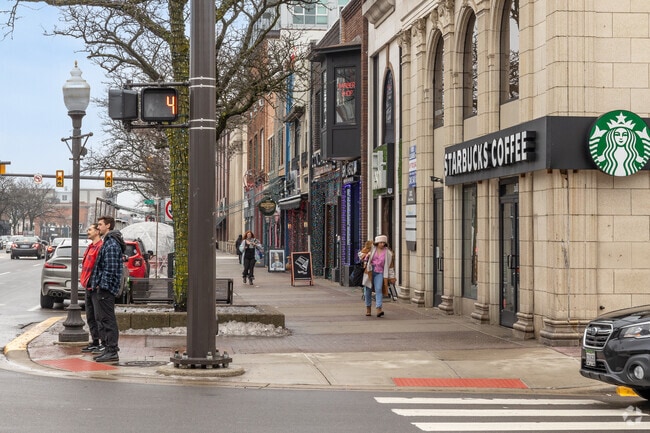
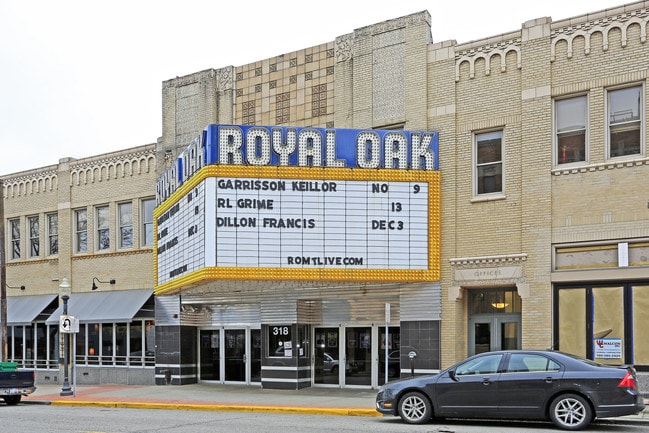
Less than 15 miles northeast of Detroit, cradled where I-75 intersects I-696, is Royal Oak. While Royal Oak is a suburb of Detroit, it also has its own downtown area containing over 70 restaurants in addition to retail shops and nightlife venues. Among the nightlife venues in Downtown Royal Oak are Royal Oak Music Theatre, Mark Ridley’s Comedy Castle, and Stagecrafters Baldwin Theatre. Major events held in Downtown Royal Oak include the Ford Arts, Beats, and Eats Festival and part of the Woodward Dream Cruise. The Detroit Zoo is also located in Royal Oak.
Convenient to major highways and Downtown Detroit, Royal Oak offers residents a small-town feel near the big-city vibe as well as simple commutes and travels.
The Royal Oak Farmers Market has plenty of options for food and artisinal treats.
Main St in downtown Royal Oaks has plenty of shops that are close to many local homes.
Median Household Income
$93,580
Average: $115,258
Education
29,690
Residents Have a Degree
Job Market
36,343
Workers Employed
Median Age
39 Years
Largest Age Group
30-39 Years
Approximately 21% of Residents
Under 20
18%
Over 65
17%
Housing Distribution
Royal Oak has more homeowners than renters.

Education Distribution
Review this city's overall education levels.

As of July 2026, the average apartment rent in Royal Oak, MI is $1,268 for a studio, $1,385 for one bedroom, $1,742 for two bedrooms, and $2,649 for three bedrooms. Apartment rent in Royal Oak has increased by 3.0% in the past year.
Explore how walkable, bikeable, drivable, and transit-friendly Royal Oak, MI is for everyday living.
Moderately Walkable
Walkability
Minimal Public Transit
Transit
Moderately Drivable
Drivability
Fairly Bikeable
Bikeability
Public
Grades K-5
432 Students

Public
Grades K-5
405 Students

Public
Grades K-5
269 Students
Alfred E. Upton Elementary School
Public
Grades K-5
309 Students

Public
Grades PK-5
457 Students

Public
Grades 6-8
1,071 Students
Public
Grades 9-12
1,273 Students
Public
Grades 9-12
1,111 Students
Churchill Community Ed. Center
Public
Grades 9-12
111 Students

Oakland Schools Technical Campus--Se
Public
Grades 9-12

† Our analysis of utilities, groceries, transportation, healthcare, home prices, and other goods and services is sourced from the Cost of Living Index, a respected benchmark published by the Council for Community and Economic Research (C2ER) that provides a thorough overview of living expenses across different regions.
Rent data is provided by CoStar Group’s Market Trend reports. As the industry leader in commercial real estate information, analytics, and news, CoStar conducts extensive research to produce and maintain a comprehensive database of commercial real estate information. We combine this data with public record to provide the most up-to-date rental information available.
Consumer goods, services, and home prices are sourced from the Cost of Living Index published by the Council for Community and Economic Research (C2ER). The data on this page is updated quarterly. It was last published in June 2026.
Demographic information comes from Neustar and combines detailed address data with U.S. Census and American Community Survey statistics to produce reliable local estimates.


