Median Age
41 Years
Largest Age Group
30-39 Years
Approximately 13% of Residents
Under 20
24%
Over 65
21%
Avg Rent
$881
Population
32,636
Renter Mix
46% Rent
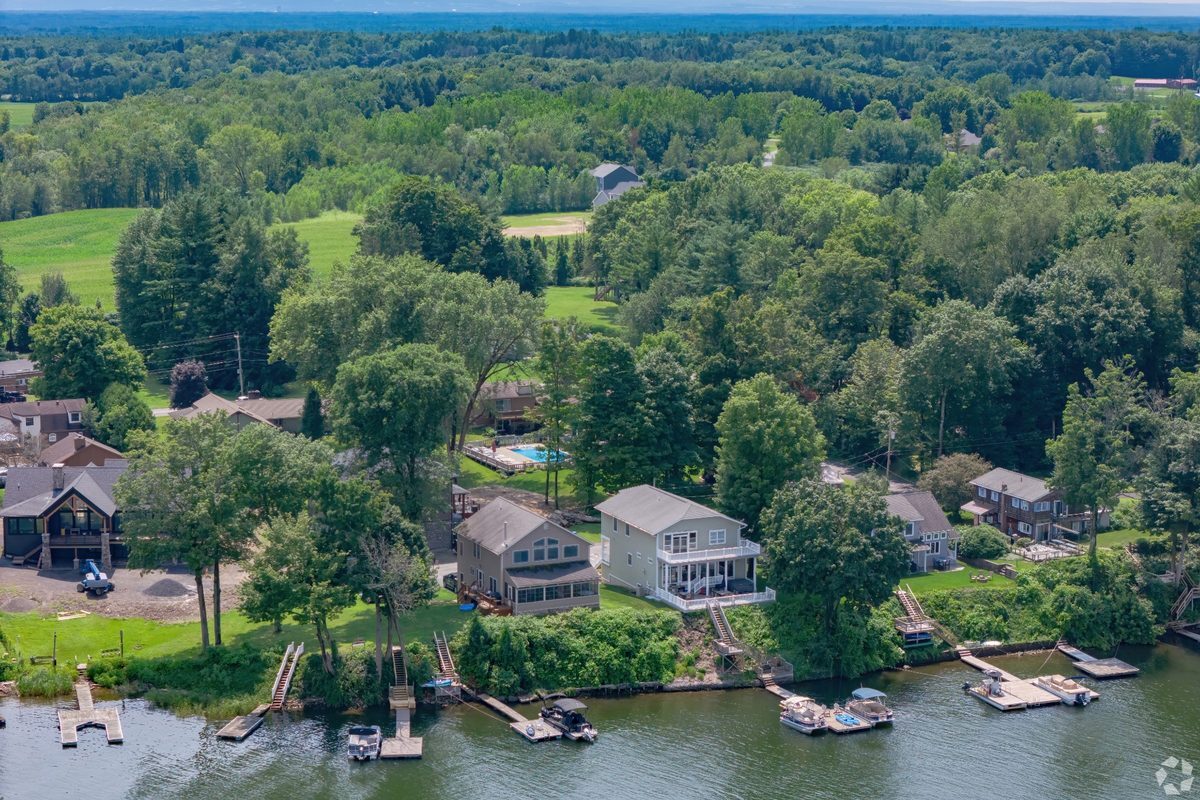
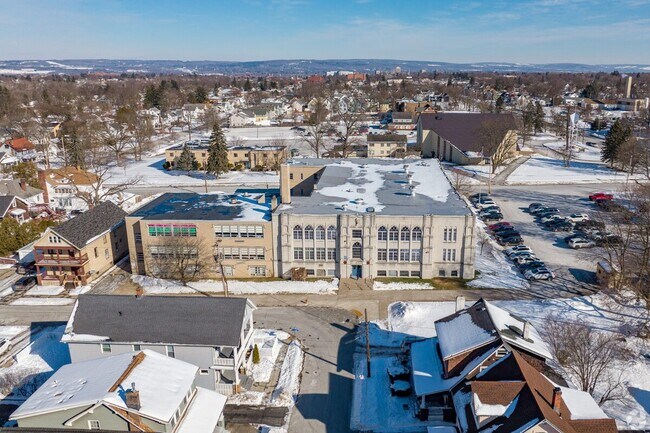
Nicknamed the Copper City due to its roots in the copper manufacturing history, Rome is a city known for its innovation and business sector. Located in Rome, the Griffiss Business and Technology Park is a massive complex that many private and public enterprises call home as well as employing thousands of workers. The Griffiss International Airport is also nearby. Another large cooperation, AmeiCU Credit Union, is headquartered in this booming city. With many opportunities for employment, a highly rated hospital, Rome Memorial Hospital, and a good school system, Rome is an ideal city for just about anyone.
While also being home to several work opportunities, Rome has many recreation opportunities as well. The John F. Kennedy Civic Arena hosts hockey games and figure skating competitions. If sports aren’t your thing, there are several other museums and art galleries to visit. For outdoor activities, the Rome Wildlife Management Area is a large park for residents to hike, fish, hunt, and enjoy the natural beauty of Upstate New York.
Median Household Income
$53,194
Average: $66,323
Education
6,256
Residents Have a Degree
Job Market
13,613
Workers Employed
Median Age
41 Years
Largest Age Group
30-39 Years
Approximately 13% of Residents
Under 20
24%
Over 65
21%
Housing Distribution
Rome has more homeowners than renters.

Education Distribution
Review this city's overall education levels.

As of July 2026, the average apartment rent in Rome, NY is $1,484 for a studio, $881 for one bedroom, $1,209 for two bedrooms, and $1,437 for three bedrooms. Apartment rent in Rome has increased by 2.3% in the past year.
The cost of living in Rome, NY is 2.8% lower than the national average. Generally, housing in Rome is 8.4% less expensive than the national average, with rent falling between $881 - $1,484. You can expect to pay 2.8% less for groceries, 2.7% more for utilities, and 6.8% more for transportation.
Compare Cities
Explore how walkable, bikeable, drivable, and transit-friendly Rome, NY is for everyday living.
Somewhat Walkable
Walkability
Minimal Public Transit
Transit
Exceptionally Drivable
Drivability
Fairly Bikeable
Bikeability
Public
Grades K-5
387 Students

Public
Grades K-5
366 Students

Louis V Denti Elementary School
Public
Grades K-5
598 Students

Public
Grades K-5
544 Students
Public
Grades K-5
397 Students
Lyndon H Strough Middle School
Public
Grades 6-8
815 Students
Public
Grades 9-12
1,509 Students
† Our analysis of utilities, groceries, transportation, healthcare, home prices, and other goods and services is sourced from the Cost of Living Index, a respected benchmark published by the Council for Community and Economic Research (C2ER) that provides a thorough overview of living expenses across different regions.
Rent data is provided by CoStar Group’s Market Trend reports. As the industry leader in commercial real estate information, analytics, and news, CoStar conducts extensive research to produce and maintain a comprehensive database of commercial real estate information. We combine this data with public record to provide the most up-to-date rental information available.
Consumer goods, services, and home prices are sourced from the Cost of Living Index published by the Council for Community and Economic Research (C2ER). The data on this page is updated quarterly. It was last published in June 2026.
Demographic information comes from Neustar and combines detailed address data with U.S. Census and American Community Survey statistics to produce reliable local estimates.


