Median Age
42 Years
Largest Age Group
35-44 Years
Approximately 13% of Residents
Under 20
23%
Over 65
22%

Avg Rent
$2,386
Population
15,473
Renter Mix
44% Rent
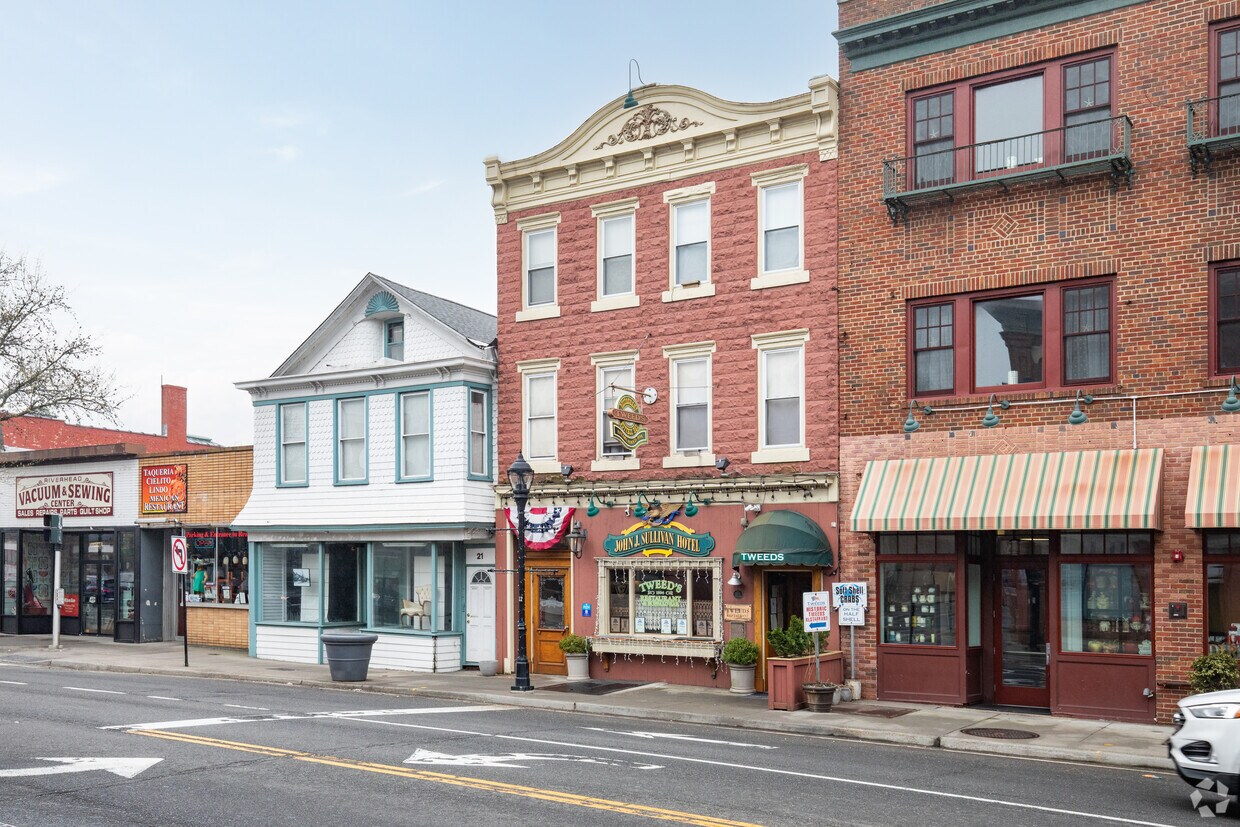
Sitting at the mouth of the Peconic River on the eastern end of Long Island, Riverhead has been Suffolk County’s seat since 1727, giving it a sense of history you can feel just walking down Main Street. The walkable downtown corridor is lined with independent shops, eateries, and the Long Island Aquarium, all within easy reach of Peconic Riverfront Park. Beaches stretch in both directions, the Hamptons are just down the road, and Long Island Rail Road service keeps New York City connected without requiring a car.
The rental market here leans toward apartment communities and townhomes, with a mix of traditional units and newer builds that attract a range of renters looking for coastal access without the steep price tags of surrounding resort towns. Polish Town, a historic district within Riverhead, hosts the beloved annual Polish Town Fair, one of the most longstanding cultural celebrations on Long Island. Whether you’re drawn by the waterfront parks, the golf courses scattered across the area, or simply the slower pace that eastern Long Island delivers, Riverhead offers a rare combination of small-town character and genuine convenience.
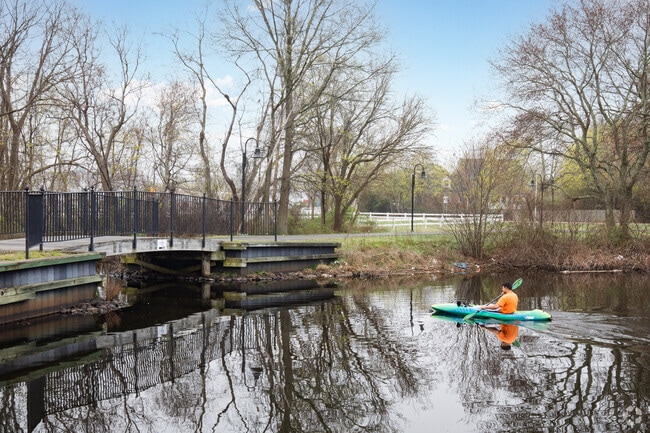
Milton L. Burns Park in Riverhead offers kayak launches along the Peconic River.
The Long Island Aquarium in Riverhead offers hands-on exhibits for all ages.
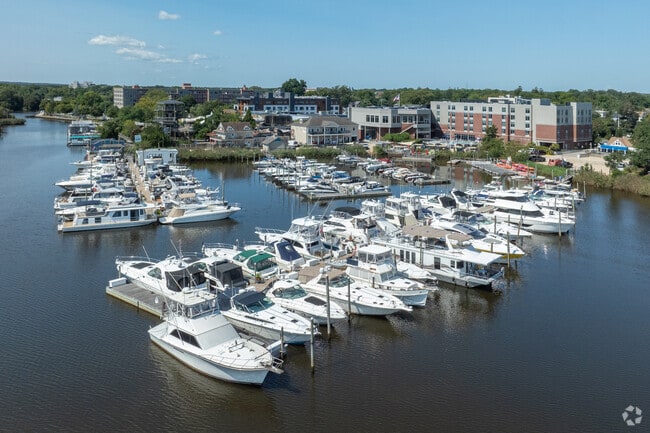
Treasure Cove Marina sits beside the Long Island Aquarium in Riverhead.
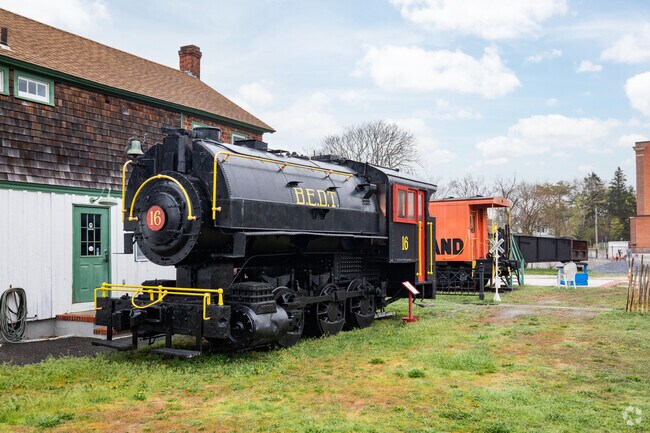
The Riverhead train station is located on Osborne Avenue and Railroad Street in Riverhead, NY.
Briermere Farm continues to draw crowds to Riverhead for its famous pies.
Milton L. Burns Park offers sweeping Peconic River views in downtown Riverhead.
Median Household Income
$63,420
Average: $85,625
Education
2,268
Residents Have a Degree
Job Market
7,206
Workers Employed
Median Age
42 Years
Largest Age Group
35-44 Years
Approximately 13% of Residents
Under 20
23%
Over 65
22%
Housing Distribution
Riverhead has more homeowners than renters.

Education Distribution
Review this city's overall education levels.

As of July 2026, the average apartment rent in Riverhead, NY is $2,130 for a studio, $2,386 for one bedroom, and $3,016 for two bedrooms. Apartment rent in Riverhead has increased by 0.7% in the past year.
Explore how walkable, bikeable, drivable, and transit-friendly Riverhead, NY is for everyday living.
Somewhat Walkable
Walkability
Exceptionally Drivable
Drivability
Fairly Bikeable
Bikeability
Pulaski Street Elementary School
Public
Grades K-5
797 Students

Public
Grades PK-5
655 Students
Public
Grades PK-5
395 Students
Public
Grades 6-8
793 Students

Public
Grades 9-12
1,927 Students
† Our analysis of utilities, groceries, transportation, healthcare, home prices, and other goods and services is sourced from the Cost of Living Index, a respected benchmark published by the Council for Community and Economic Research (C2ER) that provides a thorough overview of living expenses across different regions.
Rent data is provided by CoStar Group’s Market Trend reports. As the industry leader in commercial real estate information, analytics, and news, CoStar conducts extensive research to produce and maintain a comprehensive database of commercial real estate information. We combine this data with public record to provide the most up-to-date rental information available.
Consumer goods, services, and home prices are sourced from the Cost of Living Index published by the Council for Community and Economic Research (C2ER). The data on this page is updated quarterly. It was last published in June 2026.
Demographic information comes from Neustar and combines detailed address data with U.S. Census and American Community Survey statistics to produce reliable local estimates.


