Median Age
46 Years
Largest Age Group
50-59 Years
Approximately 16% of Residents
Under 20
25%
Over 65
20%
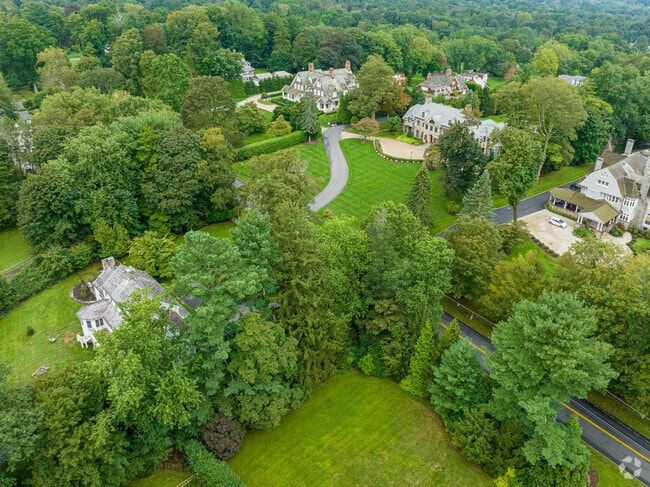
Nestled at the foothills of the Berkshire Mountains, Ridgefield has often been named “Connecticut’s #1 Town” by Connecticut Magazine for its beauty and true sense of community. Ridgefield also boasts an excellent educational system, low crime rate, and a broad range of services.
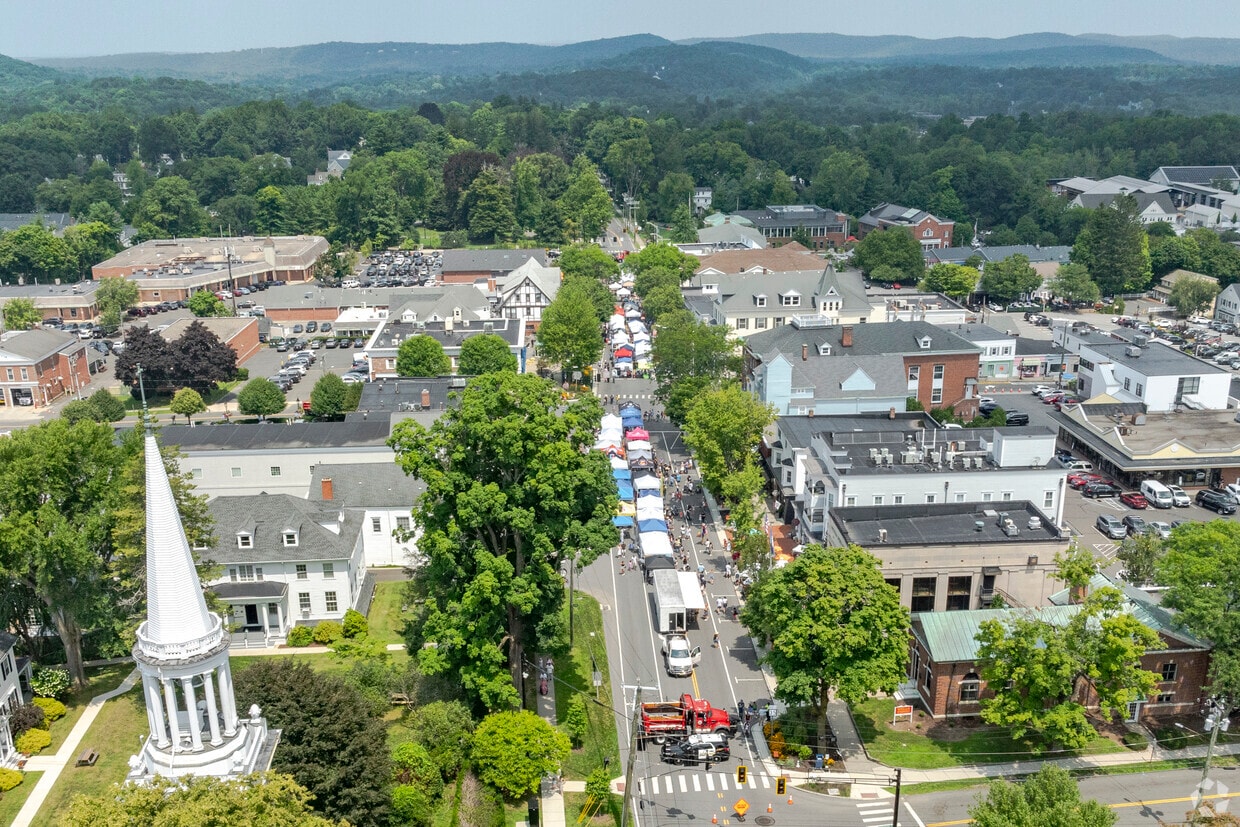
Ridgefield is renowned for its picturesque Main Street, where ornate homes, historic landmarks, a world-class modern art museum, unique boutiques, and exceptional eateries stand alongside tree-covered sidewalks. In addition to gathering downtown, Ridgefield residents come together for a variety of annual events like the Summerfest, Halloween Street Festival, Holiday Stroll, and more.
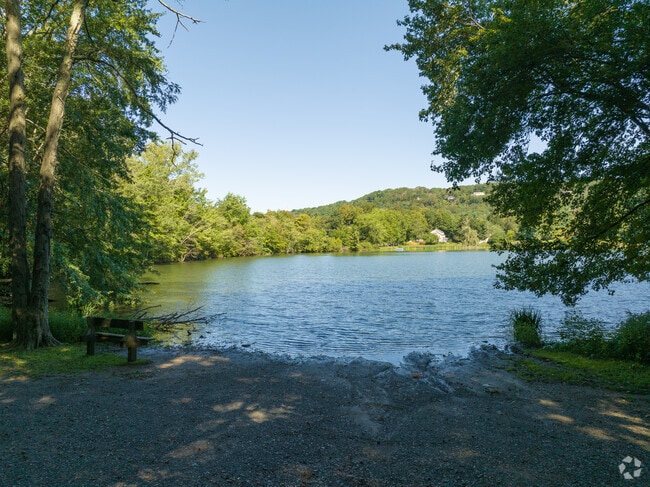
Ridgefield offers cultural activities such as concerts in the park and performances at the Playhouse. Beautiful open spaces in Ridgefield are perfect for hiking as well. New York City and its many metropolitan amenities are just over an hour’s drive from Ridgefield too.
Walking trails line the serene lakes in Ridgefield.
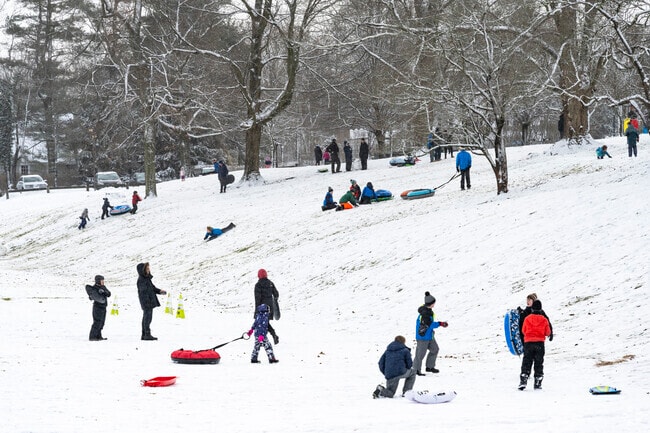
Veterans Park is a favorite sledding area in Ridgefield, CT.
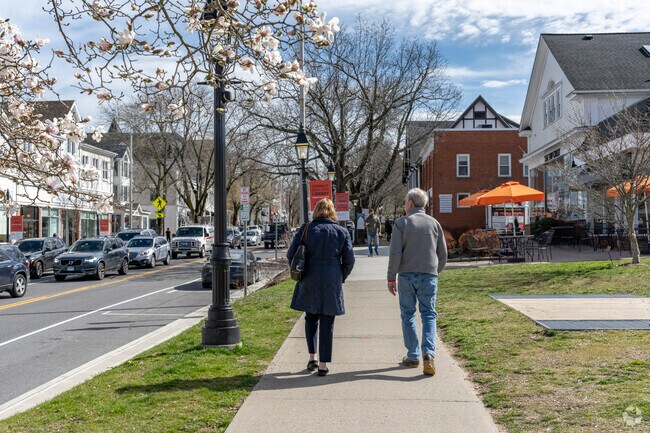
Downtown Ridgefield is an easily walkable area with shopping, dining, and Ballard Park.
The walking trails around the Ridgefield Recreation Center are in use every day of the year.
Large crowds gather for most CHIRP Concerts in Ballard Park in Ridgefield.
The Ridgefield Fireman's Carnival is a annual favorite for Ridgefield residents.
Median Household Income
$165,799
Average: $185,523
Education
13,801
Residents Have a Degree
Job Market
12,973
Workers Employed
Median Age
46 Years
Largest Age Group
50-59 Years
Approximately 16% of Residents
Under 20
25%
Over 65
20%
Housing Distribution
Ridgefield has more homeowners than renters.

Education Distribution
Review this city's overall education levels.

Explore how walkable, bikeable, drivable, and transit-friendly Ridgefield, CT is for everyday living.
Somewhat Walkable
Walkability
Exceptionally Drivable
Drivability
Fairly Bikeable
Bikeability
Veterans Park Elementary School
Public
Grades PK-5
262 Students

Barlow Mountain Elementary School
Public
Grades PK-5
371 Students

Public
Grades PK-5
359 Students
Public
Grades PK-5
318 Students
Farmingville Elementary School
Public
Grades K-5
314 Students
Public
Grades 6-8
548 Students
Public
Grades 6-8
495 Students
Public
Grades 9-12
1,474 Students
† Our analysis of utilities, groceries, transportation, healthcare, home prices, and other goods and services is sourced from the Cost of Living Index, a respected benchmark published by the Council for Community and Economic Research (C2ER) that provides a thorough overview of living expenses across different regions.
Rent data is provided by CoStar Group’s Market Trend reports. As the industry leader in commercial real estate information, analytics, and news, CoStar conducts extensive research to produce and maintain a comprehensive database of commercial real estate information. We combine this data with public record to provide the most up-to-date rental information available.
Consumer goods, services, and home prices are sourced from the Cost of Living Index published by the Council for Community and Economic Research (C2ER). The data on this page is updated quarterly. It was last published in June 2026.
Demographic information comes from Neustar and combines detailed address data with U.S. Census and American Community Survey statistics to produce reliable local estimates.


