Median Age
56 Years
Largest Age Group
65-74 Years
Approximately 17% of Residents
Under 20
15%
Over 65
37%
Avg Rent
$1,811
Population
2,689
Renter Mix
44% Rent
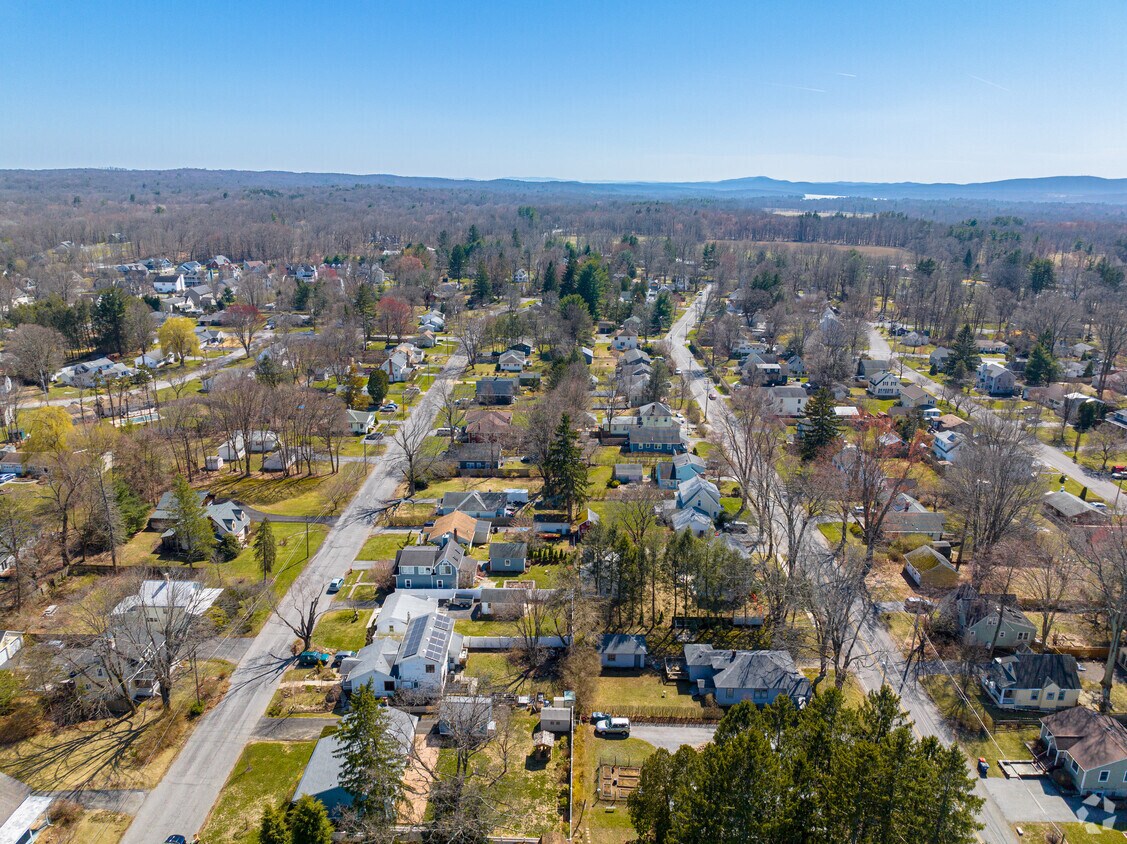
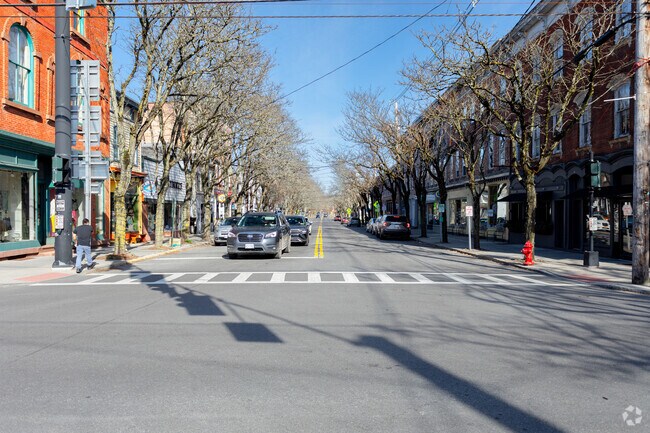
Rhinebeck, New York sits along the eastern bank of the Hudson River in Dutchess County, carrying more than 400 sites listed on the National Historic Register. The housing stock here reflects the town's historic character, with a mix of restored period homes, cottage-style rentals, and smaller apartment communities tucked into tree-lined streets.
Despite its small footprint of just two square miles, Rhinebeck punches above its size when it comes to cultural identity. The town is a recognized hub for the visual arts, performance, dance, and independent film, drawing a creative community that has steadily called the Hudson Valley home. Bard College, located just a few miles away in Annandale-on-Hudson, adds an intellectual energy that influences the area's arts programming and cultural calendar throughout the year.
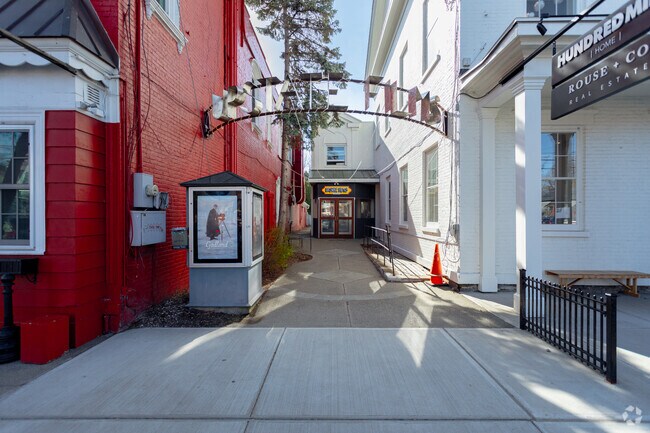
Upstate Films Theater is known for its Great Popcorn in the Rhinebeck neighborhood.
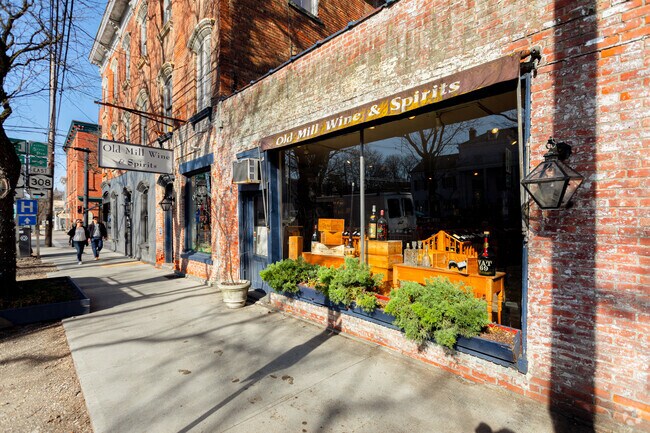
Old Mill wine & Spirits on Rhinebeck Mercantile
Even on a busy day Traffic is relatively low
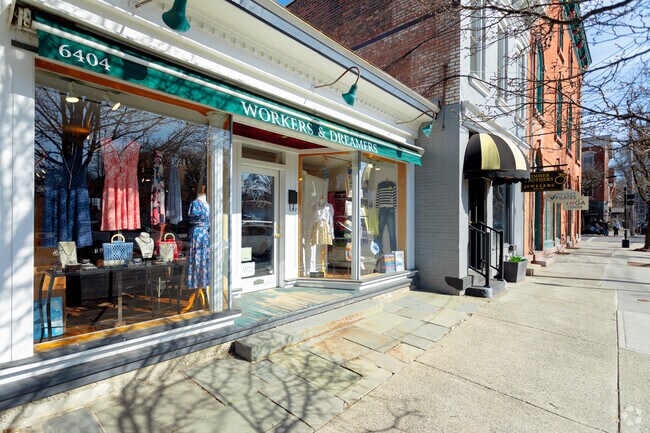
Colorful inviting store signage drawing pedestrians on in
Large single-family homes are available in the Rhinebeck community.
Local Rhinebeck Amtrak Train Stop only Connecting NYC with a calm 2 hour restful ride
Median Household Income
$72,678
Average: $101,109
Education
1,026
Residents Have a Degree
Job Market
1,398
Workers Employed
Median Age
56 Years
Largest Age Group
65-74 Years
Approximately 17% of Residents
Under 20
15%
Over 65
37%
Housing Distribution
Rhinebeck has more homeowners than renters.

Education Distribution
Review this city's overall education levels.

As of July 2026, the average apartment rent in Rhinebeck, NY is $1,810 for one bedroom, and $2,149 for two bedrooms. Apartment rent in Rhinebeck has increased by 0.8% in the past year.
Explore how walkable, bikeable, drivable, and transit-friendly Rhinebeck, NY is for everyday living.
Fairly Walkable
Walkability
Limited Public Transit
Transit
Exceptionally Drivable
Drivability
Somewhat Bikeable
Bikeability
Chancellor Livingston Elementary School
Public
Grades PK-5
392 Students

Public
Grades 6-8
211 Students

Public
Grades 9-12
315 Students

† Our analysis of utilities, groceries, transportation, healthcare, home prices, and other goods and services is sourced from the Cost of Living Index, a respected benchmark published by the Council for Community and Economic Research (C2ER) that provides a thorough overview of living expenses across different regions.
Rent data is provided by CoStar Group’s Market Trend reports. As the industry leader in commercial real estate information, analytics, and news, CoStar conducts extensive research to produce and maintain a comprehensive database of commercial real estate information. We combine this data with public record to provide the most up-to-date rental information available.
Consumer goods, services, and home prices are sourced from the Cost of Living Index published by the Council for Community and Economic Research (C2ER). The data on this page is updated quarterly. It was last published in June 2026.
Demographic information comes from Neustar and combines detailed address data with U.S. Census and American Community Survey statistics to produce reliable local estimates.


