Median Age
41 Years
Largest Age Group
30-39 Years
Approximately 13% of Residents
Under 20
24%
Over 65
22%


Avg Rent
$840
Population
40,798
Renter Mix
37% Rent
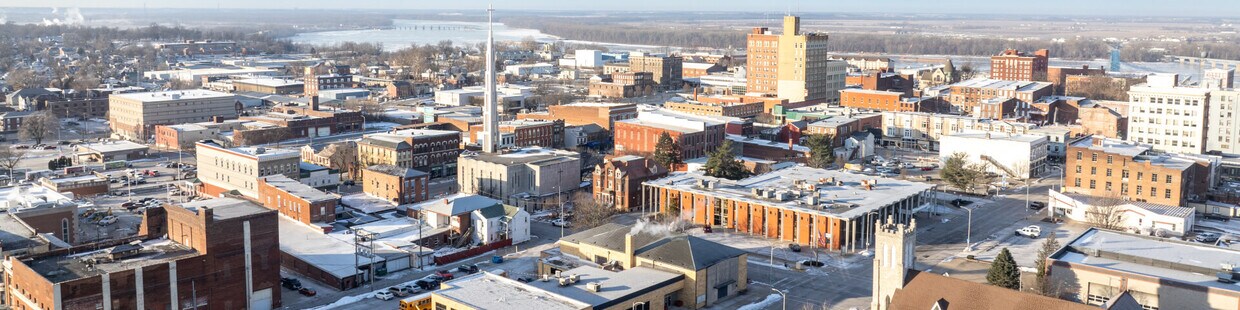
This historic piece of Illinois boasts a charming downtown district, local museums, small businesses, and a family-friendly atmosphere. Bordered by the Mississippi River to the west and Interstate 172 to the east, both riverfront views and accessibility are on your side as a resident of Quincy. The Quincy Amtrak Station is another option for residents who prefer public transit. The Downtown Quincy Historic District offers historic buildings and storefronts from the late 1800s.
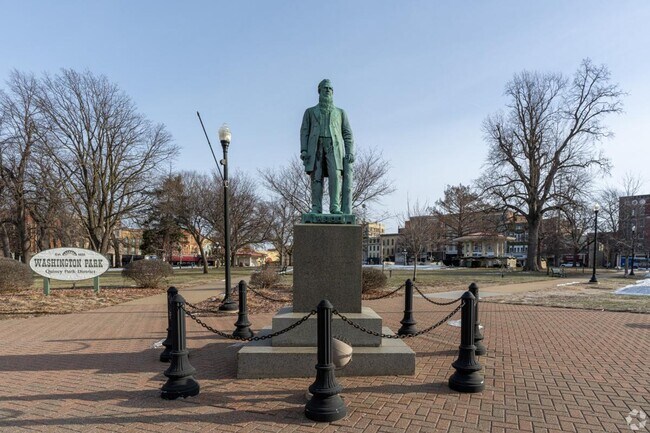
History buffs appreciate the local gems in town like the Quincy Museum that sits in a restored Richardsonian Romanesque mansion. This must-visit offers unique historic architecture that sets the tone for this city. Nearing the Mississippi River are wonderful community spots like Washington Park, Clat Adams Bicentennial Park, Riverview Park, and more. Great public schools and Quincy University call this city home, along with thriving local businesses such as BoodaLu Steakhouse overlooking the Mississippi.
Pass over the Quincy Bayview Bridge to get into town.
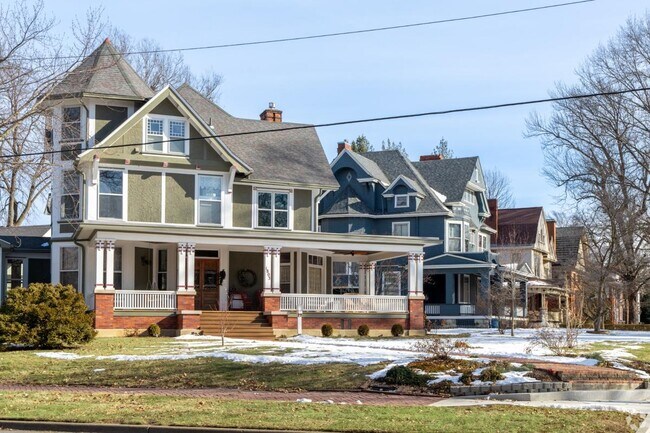
Historic homes line the streets.
Washington Park is the heart of the city.
Median Household Income
$52,362
Average: $69,139
Education
8,983
Residents Have a Degree
Job Market
19,968
Workers Employed
Median Age
41 Years
Largest Age Group
30-39 Years
Approximately 13% of Residents
Under 20
24%
Over 65
22%
Housing Distribution
Quincy has more homeowners than renters.

Education Distribution
Review this city's overall education levels.

As of August 2026, the average apartment rent in Quincy, IL is $840 for one bedroom, $949 for two bedrooms, and $1,033 for three bedrooms. Apartment rent in Quincy has increased by 2.7% in the past year.
The cost of living in Quincy, IL is 6.8% lower than the national average. Generally, housing in Quincy is 7.5% less expensive than the national average, with rent falling between $0 - $1,033. You can expect to pay 1.9% less for groceries, 11.9% less for utilities, and 2.7% less for transportation.
Compare Cities
Explore how walkable, bikeable, drivable, and transit-friendly Quincy, IL is for everyday living.
Fairly Walkable
Walkability
Exceptionally Drivable
Drivability
Fairly Bikeable
Bikeability
Public
Grades K-5
583 Students

Thomas S Baldwin Elementary School
Public
Grades K-5
557 Students

Public
Grades K-5
495 Students
Public
Grades K-5
529 Students

Public
Grades K-5
491 Students

Public
Grades 6-8
1,285 Students

Public
Grades 6-12

Public
Grades 9-12
1,764 Students

Public
Grades 9-12
Public
Grades 6-12
Public
Grades 9-12
† Our analysis of utilities, groceries, transportation, healthcare, home prices, and other goods and services is sourced from the Cost of Living Index, a respected benchmark published by the Council for Community and Economic Research (C2ER) that provides a thorough overview of living expenses across different regions.
Rent data is provided by CoStar Group’s Market Trend reports. As the industry leader in commercial real estate information, analytics, and news, CoStar conducts extensive research to produce and maintain a comprehensive database of commercial real estate information. We combine this data with public record to provide the most up-to-date rental information available.
Consumer goods, services, and home prices are sourced from the Cost of Living Index published by the Council for Community and Economic Research (C2ER). The data on this page is updated quarterly. It was last published in June 2026.
Demographic information comes from Neustar and combines detailed address data with U.S. Census and American Community Survey statistics to produce reliable local estimates.


