Median Age
43 Years
Largest Age Group
55-64 Years
Approximately 14% of Residents
Under 20
22%
Over 65
21%
Avg Rent
$1,774
Population
9,435
Renter Mix
42% Rent
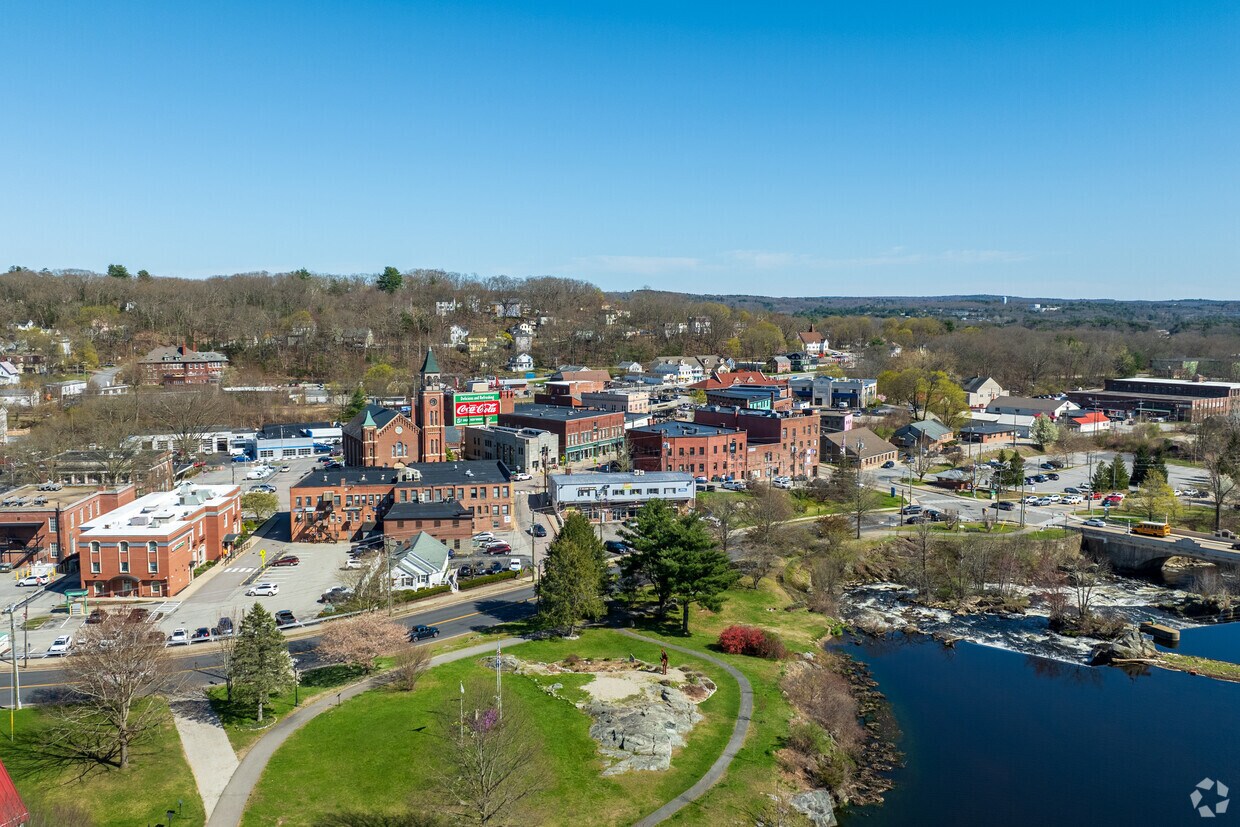
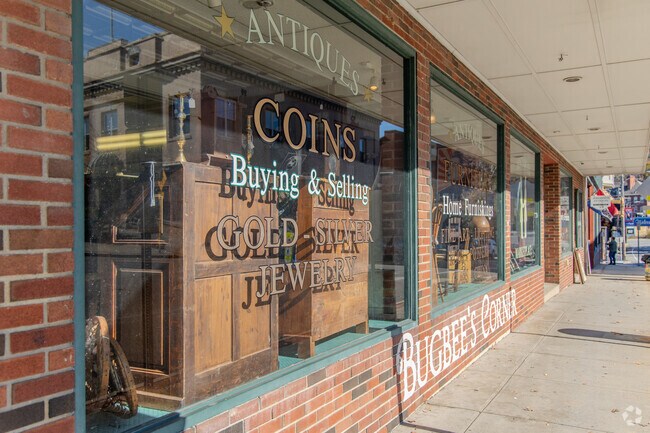
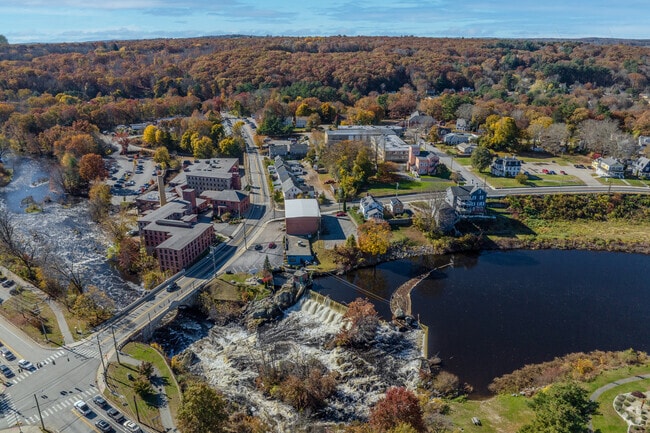
Nestled in northeast Connecticut, Putnam is a small, forested town on the Rhode Island state line. Although Putnam is mainly residential with large expanses of dense woodlands, there is a sense of small-town charm in Putnam you’ll be sure to enjoy. Putnam Town Hall, the Boxcar Museum, and Rotary Park are just a few of the unique, historic attractions this town has to offer. The Quinebaug River runs directly through town, so the stately homes and small businesses on either side of the river in downtown can enjoy waterfront views. The city’s downtown district is lined with local restaurants and shops such as 85 Main, the Stomping Ground, Elizabeth’s Farmhouse, and the Courthouse Bar and Grille. Historic lofts, charming single-family homes, and longstanding apartments can be found in the city of Putnam.
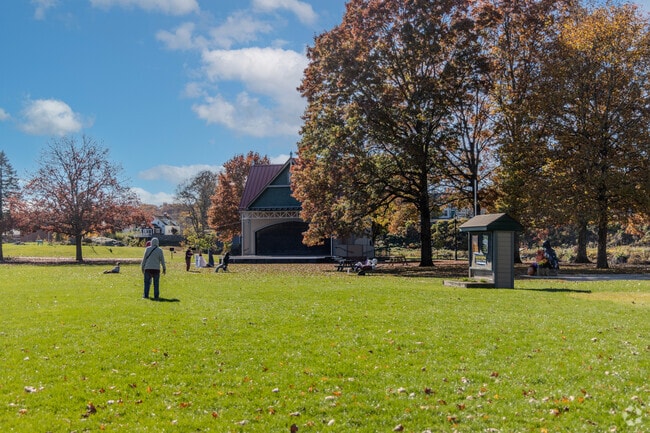
Locals gather to relax and connect in Putnam's parks.
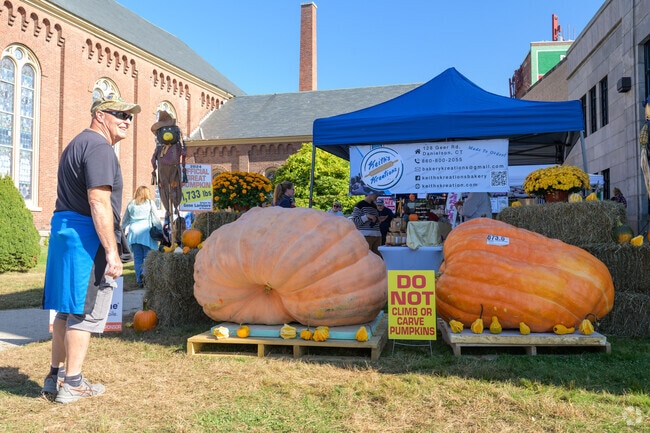
Putnam is known for its historic downtown that is the center of life and commerce.
The historic downtown in Putnam sits right along the river and is surrounded by trees.
Residents in Putnam enjoy riverfront parks and trails.
Enjoy a walk alone or with someone else at one of the many parks in Putnam.
Downtown Putnam in Connecticut has historic buildings that house local businesses.
Median Household Income
$68,580
Average: $82,048
Education
1,934
Residents Have a Degree
Job Market
4,797
Workers Employed
Median Age
43 Years
Largest Age Group
55-64 Years
Approximately 14% of Residents
Under 20
22%
Over 65
21%
Housing Distribution
Putnam has more homeowners than renters.

Education Distribution
Review this city's overall education levels.

As of July 2026, the average apartment rent in Putnam, CT is $1,484 for a studio, $1,774 for one bedroom, and $1,911 for two bedrooms. Apartment rent in Putnam has increased by 1.0% in the past year.
Explore how walkable, bikeable, drivable, and transit-friendly Putnam, CT is for everyday living.
Not Walkable
Walkability
Exceptionally Drivable
Drivability
Somewhat Bikeable
Bikeability
Public
Grades K-8
353 Students

Public
Grades PK-5
558 Students

Public
Grades K-8
353 Students
Public
Grades 9-12
253 Students
Public
Grades 9-12
4 Students

† Our analysis of utilities, groceries, transportation, healthcare, home prices, and other goods and services is sourced from the Cost of Living Index, a respected benchmark published by the Council for Community and Economic Research (C2ER) that provides a thorough overview of living expenses across different regions.
Rent data is provided by CoStar Group’s Market Trend reports. As the industry leader in commercial real estate information, analytics, and news, CoStar conducts extensive research to produce and maintain a comprehensive database of commercial real estate information. We combine this data with public record to provide the most up-to-date rental information available.
Consumer goods, services, and home prices are sourced from the Cost of Living Index published by the Council for Community and Economic Research (C2ER). The data on this page is updated quarterly. It was last published in June 2026.
Demographic information comes from Neustar and combines detailed address data with U.S. Census and American Community Survey statistics to produce reliable local estimates.


