Median Age
43 Years
Largest Age Group
55-64 Years
Approximately 14% of Residents
Under 20
22%
Over 65
21%


Avg Rent
$2,565
Population
36,732
Renter Mix
36% Rent
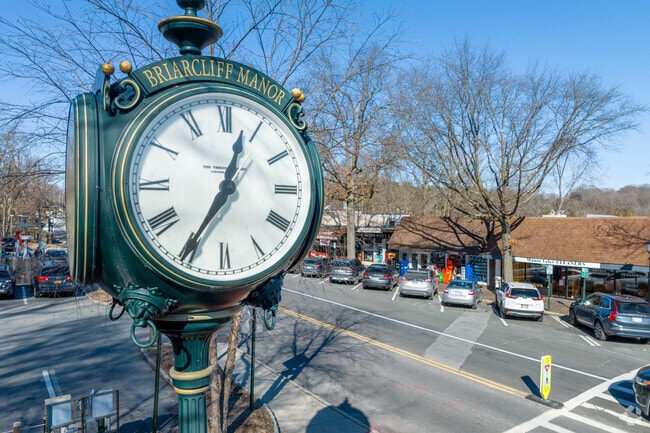
Ossining sits on the eastern bank of the Hudson River in Westchester County, about 30 miles north of Midtown Manhattan, giving it a small-town feel with genuine access to one of the world's great cities. The Metro-North Harlem Line makes commuting straightforward, so residents can enjoy quieter surroundings without giving up big-city opportunity. The town carries a layered history. Sing Sing Correctional Facility, established here in 1828, put Ossining on the map long before the rest of the region caught up, and that heritage is woven into the character of the place. The downtown area, centered on Main Street, has an active local economy with independent shops and eateries that have served the community for generations. Neighborhoods range from hilltop areas with sweeping river views to flatter stretches closer to the waterfront, offering a variety of settings and price points for renters. The housing mix reflects that range well: classic pre-war brick buildings, converted townhomes, and newer apartment communities with updated finishes all have a presence here. Studios and one-bedroom units are well-represented, while larger two- and three-bedroom options accommodate those needing more space. Westchester Community College is nearby, adding an educational anchor to the region. For renters who want Hudson Valley scenery, a real sense of community, and a manageable commute to New York City, Ossining delivers on all three fronts.
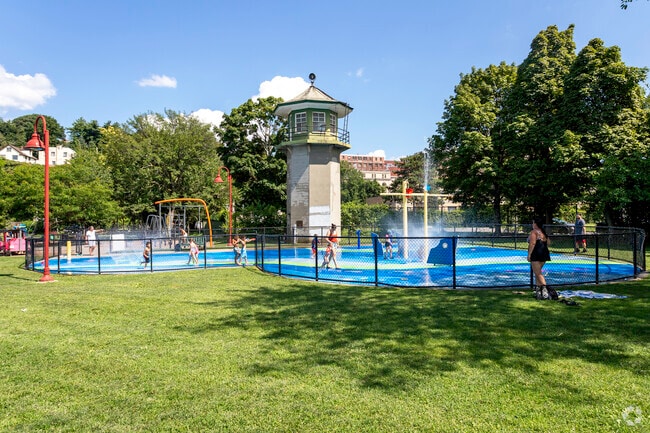
Louis Engle Park is the place to be in Ossining on a hot day.
Hudson Valley Books for Humanity in Ossining is a haven for book lovers.
People come from all over Westchester to watch Blues at the Up the River Blues Festival.
Median Household Income
$113,390
Average: $143,600
Education
14,746
Residents Have a Degree
Job Market
19,826
Workers Employed
Median Age
43 Years
Largest Age Group
55-64 Years
Approximately 14% of Residents
Under 20
22%
Over 65
21%
Housing Distribution
Ossining has more homeowners than renters.

Education Distribution
Review this city's overall education levels.

As of July 2026, the average apartment rent in Ossining, NY is $1,703 for a studio, $2,565 for one bedroom, $3,444 for two bedrooms, and $3,057 for three bedrooms. Apartment rent in Ossining has increased by 2.4% in the past year.
Explore how walkable, bikeable, drivable, and transit-friendly Ossining, NY is for everyday living.
Moderately Walkable
Walkability
Some Public Transit
Transit
Very Drivable
Drivability
Somewhat Bikeable
Bikeability
Public
Grades K-5
732 Students

Public
Grades K-5
374 Students

Public
Grades K-5
673 Students

Public
Grades PK-5
572 Students
Public
Grades 6-8
1,031 Students

Public
Grades 9-12
1,580 Students
† Our analysis of utilities, groceries, transportation, healthcare, home prices, and other goods and services is sourced from the Cost of Living Index, a respected benchmark published by the Council for Community and Economic Research (C2ER) that provides a thorough overview of living expenses across different regions.
Rent data is provided by CoStar Group’s Market Trend reports. As the industry leader in commercial real estate information, analytics, and news, CoStar conducts extensive research to produce and maintain a comprehensive database of commercial real estate information. We combine this data with public record to provide the most up-to-date rental information available.
Consumer goods, services, and home prices are sourced from the Cost of Living Index published by the Council for Community and Economic Research (C2ER). The data on this page is updated quarterly. It was last published in June 2026.
Demographic information comes from Neustar and combines detailed address data with U.S. Census and American Community Survey statistics to produce reliable local estimates.


