Median Age
38 Years
Largest Age Group
25-34 Years
Approximately 14% of Residents
Under 20
26%
Over 65
19%

Avg Rent
$840
Population
19,786
Renter Mix
44% Rent
Sitting on the Sabine River at the Texas-Louisiana border, Orange holds the distinction of being the easternmost city in Texas — a geographic bragging right that comes with bayous, wildlife refuges, and deep-water port access to the Gulf. Daily life here revolves around the outdoors, with the Sabine National Wildlife Refuge and Lower Neches Wildlife Management Area offering escapes into nature. Downtown anchors the cultural scene with the Stark Museum of Art, the 1894 W.H. Stark House Victorian mansion, and the Lutcher Theater.
The rental market in Orange leans toward approachable living, with apartment communities, single-family rentals, and townhomes spread throughout the city. Orange remains notably affordable compared to nearby Beaumont and Port Arthur. Originally known as Green's Bluff before being renamed in 1858, Orange has a long history tied to river trade and industry. That layered past gives the city genuine, grounded character.
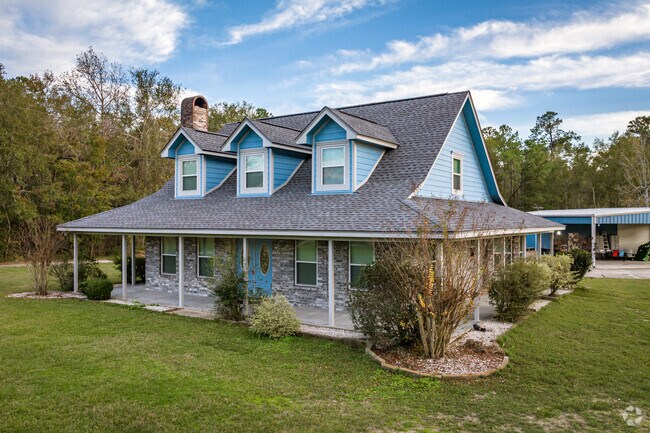
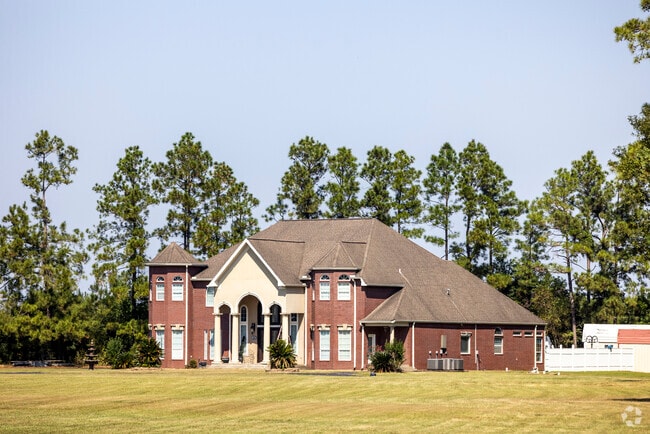
Stately homes on large lots are common in Starks.
Median Household Income
$59,650
Average: $88,031
Education
3,220
Residents Have a Degree
Job Market
8,573
Workers Employed
Median Age
38 Years
Largest Age Group
25-34 Years
Approximately 14% of Residents
Under 20
26%
Over 65
19%
Housing Distribution
Orange has more homeowners than renters.

Education Distribution
Review this city's overall education levels.

As of July 2026, the average apartment rent in Orange, TX is $1,020 for a studio, $840 for one bedroom, $973 for two bedrooms, and $1,183 for three bedrooms. Apartment rent in Orange has decreased by -3.4% in the past year.
Explore how walkable, bikeable, drivable, and transit-friendly Orange, TX is for everyday living.
Not Walkable
Walkability
Exceptionally Drivable
Drivability
Somewhat Bikeable
Bikeability
Public
Grades PK-5
268 Students

Mauriceville Elementary School
Public
Grades PK-5
505 Students

Little Cypress Intermediate School
Public
Grades K-5
344 Students
West Orange-Stark Elementary School
Public
Grades K-5
1,133 Students

Little Cypress Elementary School
Public
Grades PK-5
653 Students
Little Cypress-Mauricerville High School
Public
Grades 6-12
1,000 Students

Little Cypress Junior High School
Public
Grades 6-8
523 Students
Public
Grades 6-8
272 Students
Orangefield Junior High School
Public
Grades 6-8
390 Students
Public
Grades 6-8
292 Students
Little Cypress-Mauricerville High School
Public
Grades 6-12
1,000 Students
Public
Grades 9-12
659 Students
Public
Grades 6-12
294 Students
† Our analysis of utilities, groceries, transportation, healthcare, home prices, and other goods and services is sourced from the Cost of Living Index, a respected benchmark published by the Council for Community and Economic Research (C2ER) that provides a thorough overview of living expenses across different regions.
Rent data is provided by CoStar Group’s Market Trend reports. As the industry leader in commercial real estate information, analytics, and news, CoStar conducts extensive research to produce and maintain a comprehensive database of commercial real estate information. We combine this data with public record to provide the most up-to-date rental information available.
Consumer goods, services, and home prices are sourced from the Cost of Living Index published by the Council for Community and Economic Research (C2ER). The data on this page is updated quarterly. It was last published in June 2026.
Demographic information comes from Neustar and combines detailed address data with U.S. Census and American Community Survey statistics to produce reliable local estimates.


