
Rise Red Mountain
1010 Beacon Pky E,
Homewood, AL 35209
$1,595 - $2,580
1-2 Beds
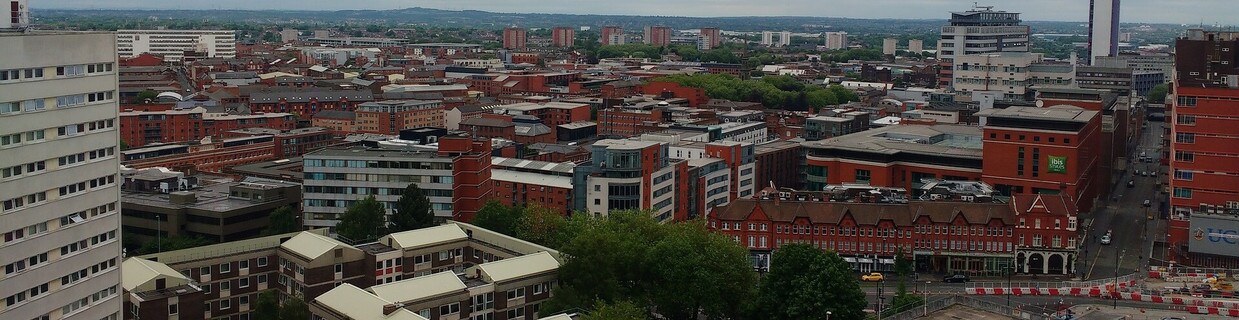
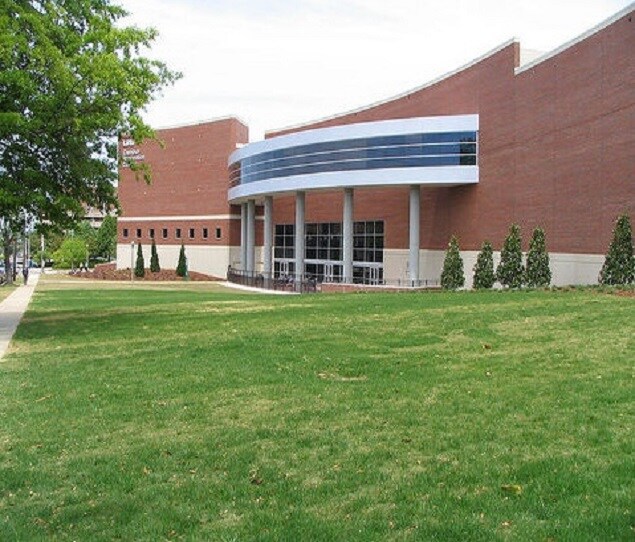
From humble beginnings in 1969, the University of Alabama at Birmingham has experienced tremendous growth in size, quality, reputation, and impact. UAB is a comprehensive university equipped with a nationally recognized academic health center, offering more than 115 areas of study. Situated in Alabama’s largest city, UAB is also Birmingham’s largest employer. The Blazers sports teams compete in NCAA Division I Conference USA. The university is located in the hip Five Points South neighborhood, adjacent to Downtown Birmingham, so options for housing are abundant. School of Dentistry students and faculty may want to focus their search on the east side of campus, nearby 19th and 20th Streets South, while those frequenting the School of Business might prefer to concentrate on the west side of campus, between 11th and 12th Streets South. With hundreds of student organizations and activities for every possible interest as well as tons of urban amenities, you can always find something to do near the University of Alabama at Birmingham.
As of March 2026, the average apartment rent in Birmingham, AL is $990 for a studio, $1,181 for one bedroom, $1,300 for two bedrooms, and $1,578 for three bedrooms. Apartment rent in Birmingham has decreased by -0.1% in the past year.
Studio
471 sq ft
Average Sq Ft
$990/month
Average Rent
1 BR
744 sq ft
Average Sq Ft
$1,181/month
Average Rent
2 BR
1,033 sq ft
Average Sq Ft
$1,300/month
Average Rent
3 BR
1,343 sq ft
Average Sq Ft
$1,578/month
Average Rent
Somewhat Walkable
out of 100 WalkScore® Rating
You might be able to get out and walk when living in this area. Some errands can be accomplished on foot, but for others you’ll need a car.
Minimal Transit
out of 100 TransitScore® Rating
You'll likely want a car when living in this area since it has few transit options.
Somewhat Bikeable
out of 100 BikeScore® Rating
You might be able to find places to ride your bike in this area, but you’ll most likely want your car for most errands.
Oak Mountain Elementary School
Public
Grades PK-3
713 Students

Oak Mountain Intermediate School
Public
Grades 4-5
619 Students
Public
Grades K-5
514 Students
Public
Grades PK-8
654 Students

Public
Grades PK-3
582 Students
Public
Grades PK-8
654 Students
Public
Grades PK-8
567 Students

Public
Grades PK-8
333 Students
Public
Grades 6-8
1,175 Students

South Hampton Elementary School
Public
Grades PK-8
513 Students
Public
Grades 9-12
1,561 Students

Public
Grades 9-12
660 Students
Public
Grades 8-12
1,147 Students

Public
Grades 9-12
826 Students
George Washington Carver High School
Public
Grades 9-12
531 Students

3,473
Communities
956,298
Units
897
Cities

715
Communities
198,736
Units
340
Cities

624
Communities
125,068
Units
245
Cities

622
Communities
173,490
Units
246
Cities

551
Communities
123,222
Units
220
Cities

461
Communities
109,065
Units
230
Cities
† Our analysis of utilities, groceries, transportation, healthcare, home prices, and other goods and services is sourced from the Cost of Living Index, a respected benchmark published by the Council for Community and Economic Research (C2ER) that provides a thorough overview of living expenses across different regions.
Rent data is provided by CoStar Group’s Market Trend reports. As the industry leader in commercial real estate information, analytics, and news, CoStar conducts extensive research to produce and maintain a comprehensive database of commercial real estate information. We combine this data with public record to provide the most up-to-date rental information available.
Consumer goods, services, and home prices are sourced from the Cost of Living Index published by the Council for Community and Economic Research (C2ER). The data on this page is updated quarterly. It was last published in February 2026.


