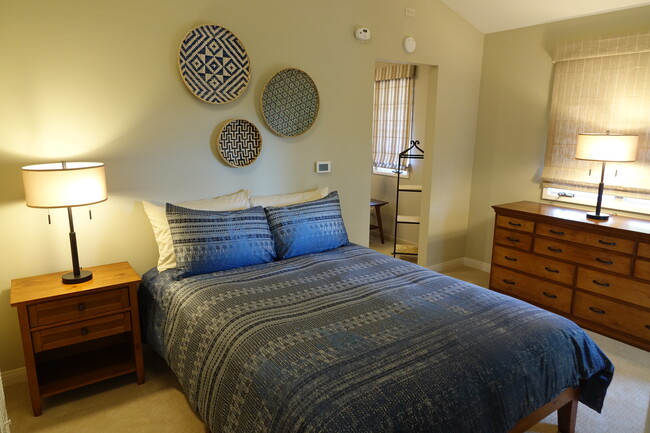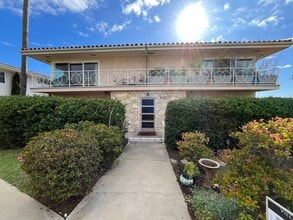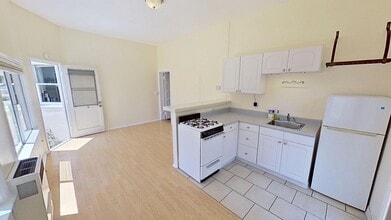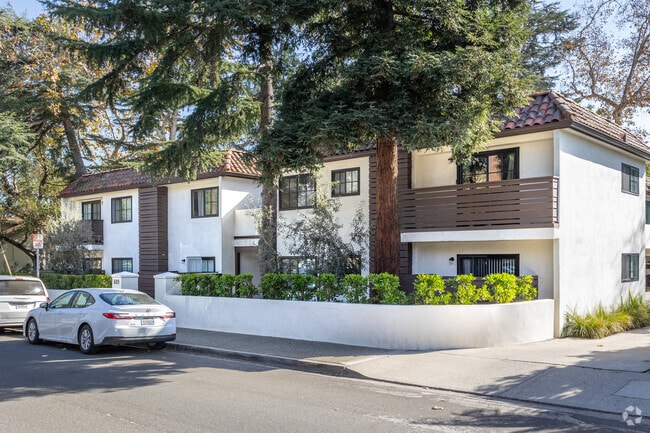
609 W Junipero St
609 W Junipero St,
Santa Barbara, CA 93105
$3,675 - $4,875
2 Beds

Area Guide
The residential district of Oak Park sits close to downtown Santa Barbara with its shops, theaters, and eateries. Rent a condo or apartment in this area and stroll down to State Street to equip your new home with unique items from independent stores such as the Fusion Gallery & Boutique and Italian Pottery Outlet. For fresh produce, visit the twice-weekly Santa Barbara Farmers Market or drop by the Santa Barbara Public Market for tastings, demonstrations, and a bite to eat. Closer to home, visit the legendary Santa Barbara Chicken Ranch for the juiciest chicken and smoky flavored Tri-Tip. Head to Los Agaves on De La Vina Street for tasty guacamole and generously-sized servings of chicken enchilada. Work off those calories on the hiking trails in the nearby Santa Ynez mountains or visit Santa Barbara's glorious sandy beaches to play volleyball and enjoy water sports.
As of September 2026, the average apartment rent in Oak Park is $1,564 for a studio, $1,837 for one bedroom, $2,923 for two bedrooms, and $3,269 for three bedrooms. Apartment rent in Oak Park has increased by 1.3% in the past year.
Studio
232 sq ft
Average Sq Ft
$1,564/month
Average Rent
1 BR
377 sq ft
Average Sq Ft
$1,837/month
Average Rent
2 BR
412 sq ft
Average Sq Ft
$2,923/month
Average Rent
3 BR
0 sq ft
Average Sq Ft
$3,269/month
Average Rent
Explore how walkable, bikeable, drivable, and transit-friendly Oak Park - Santa Barbara, CA is for everyday living.
Very Walkable
Walkability
Some Public Transit
Transit
Fairly Drivable
Drivability
Moderately Bikeable
Bikeability
In Oak Park - Santa Barbara, CA, daily errands are quick and hassle-free.
Supermarket Within a 10 Minute Walk
Groceries
Great Restaurant Variety Nearby
Restaurants
Good Café Variety Nearby
Cafes
Great Variety of Shops Nearby
Shopping
Get a sense of what it’s like to live in Oak Park - Santa Barbara, CA from everyday activity to noise and nightlife.
Vibrant Atmosphere at Times
Vibrancy
Great Nightlife Variety Nearby
Nightlife
Very Noisy
Quiet Score

† Our analysis of utilities, groceries, transportation, healthcare, home prices, and other goods and services is sourced from the Cost of Living Index, a respected benchmark published by the Council for Community and Economic Research (C2ER) that provides a thorough overview of living expenses across different regions.
Rent data is provided by CoStar Group’s Market Trend reports. As the industry leader in commercial real estate information, analytics, and news, CoStar conducts extensive research to produce and maintain a comprehensive database of commercial real estate information. We combine this data with public record to provide the most up-to-date rental information available.
Consumer goods, services, and home prices are sourced from the Cost of Living Index published by the Council for Community and Economic Research (C2ER). The data on this page is updated quarterly. It was last published in September 2026.
Demographic information comes from Neustar and combines detailed address data with U.S. Census and American Community Survey statistics to produce reliable local estimates.