Median Age
42 Years
Largest Age Group
35-44 Years
Approximately 14% of Residents
Under 20
23%
Over 65
20%
Area Guide
Avg Rent
$1,857
Population
10,475
Renter Mix
30% Rent
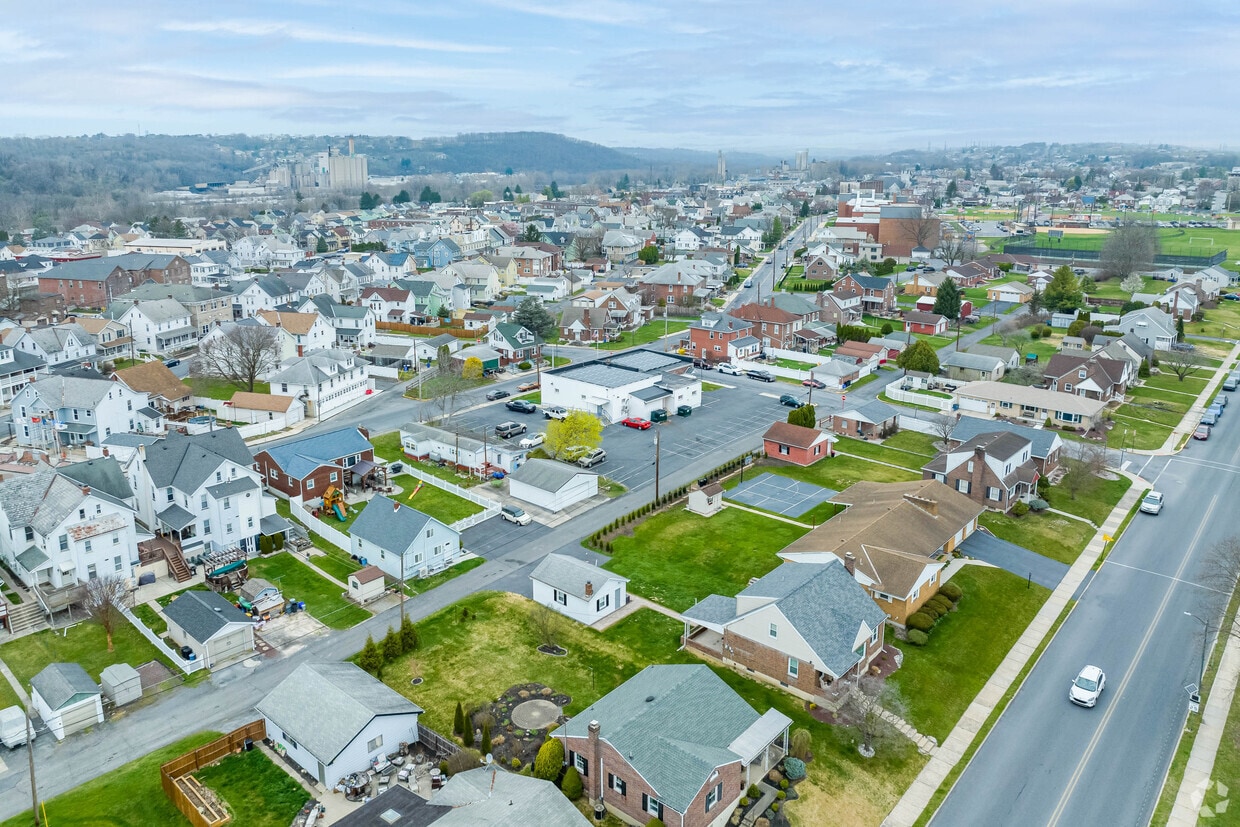
Nearly eight miles north of Allentown along the Lehigh River is where you’ll find Northampton. This Pennsylvania suburb holds a variety of homes and apartments in all shapes and styles. It’s more densely packed than your typical suburb thanks to its proximity to the city, which also means there’s plenty of amenities and attractions to keep renters entertained.
Main Street and the area closest to the water is where you’ll find the bulk of Northampton’s culinary offerings. Pubs and taco spots share the streets with bakeries and more, and there’s plenty of parks to enjoy on or off the water. The Lehigh Valley International Airport is just south of Northampton, so if you travel for work or just like the adventure, you’ll appreciate the convenience of living in Northampton.
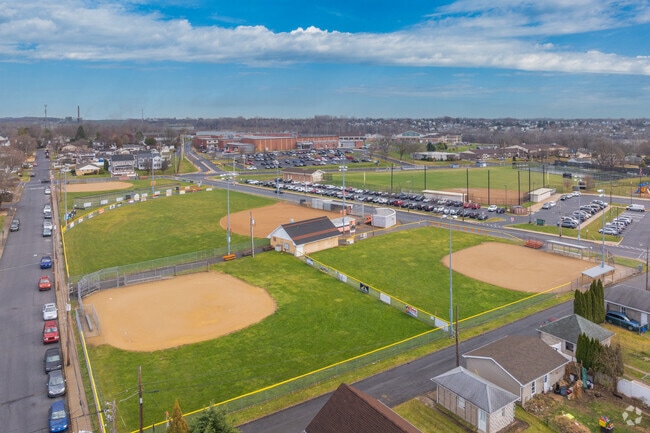
Catch a Little League game in the Northampton Historic District.
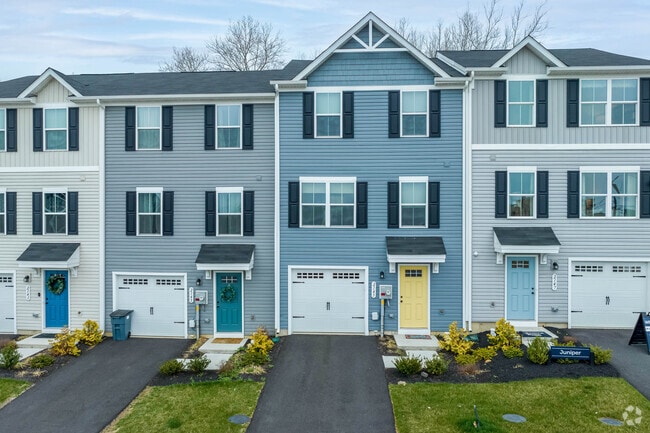
The Northampton Historical District prides itself on low-cost homes and well-bonded neighbors.
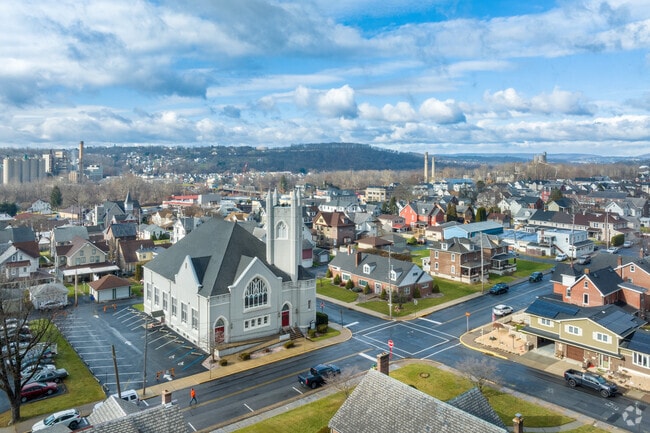
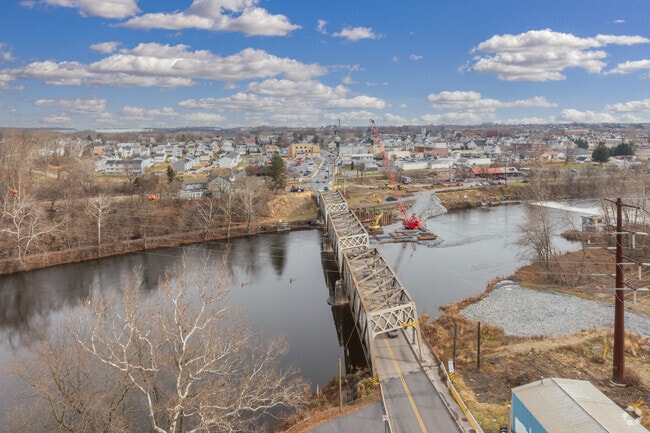
The Woodward Bridge connects Cementon and the Northampton Historic District.
The Roxy Theater features modern films in an old theater in the Northampton Historic District.
Businesses, restaurants and homes stretch along Main Street in historical Northampton.
Locals find strolling along Northampton's friendly, safe sidewalks pleasant.
Median Household Income
$78,310
Average: $87,135
Education
1,697
Residents Have a Degree
Job Market
5,550
Workers Employed
Median Age
42 Years
Largest Age Group
35-44 Years
Approximately 14% of Residents
Under 20
23%
Over 65
20%
Housing Distribution
Northampton has more homeowners than renters.

Education Distribution
Review this city's overall education levels.

As of July 2026, the average apartment rent in Northampton, PA is $1,857 for one bedroom, $2,042 for two bedrooms, and $1,731 for three bedrooms. Apartment rent in Northampton has increased by 7.3% in the past year.
Explore how walkable, bikeable, drivable, and transit-friendly Northampton, PA is for everyday living.
Fairly Walkable
Walkability
Limited Public Transit
Transit
Moderately Drivable
Drivability
Moderately Bikeable
Bikeability
Colonel John Siegfried Elementary School
Public
Grades K-5
820 Students

Public
Grades 6-8
1,185 Students

Public
Grades 9-12
1,862 Students

Public
Grades 9-12
467 Students
† Our analysis of utilities, groceries, transportation, healthcare, home prices, and other goods and services is sourced from the Cost of Living Index, a respected benchmark published by the Council for Community and Economic Research (C2ER) that provides a thorough overview of living expenses across different regions.
Rent data is provided by CoStar Group’s Market Trend reports. As the industry leader in commercial real estate information, analytics, and news, CoStar conducts extensive research to produce and maintain a comprehensive database of commercial real estate information. We combine this data with public record to provide the most up-to-date rental information available.
Consumer goods, services, and home prices are sourced from the Cost of Living Index published by the Council for Community and Economic Research (C2ER). The data on this page is updated quarterly. It was last published in June 2026.
Demographic information comes from Neustar and combines detailed address data with U.S. Census and American Community Survey statistics to produce reliable local estimates.


