Median Age
42 Years
Largest Age Group
30-39 Years
Approximately 14% of Residents
Under 20
21%
Over 65
19%

Avg Rent
$2,473
Population
55,422
Renter Mix
64% Rent
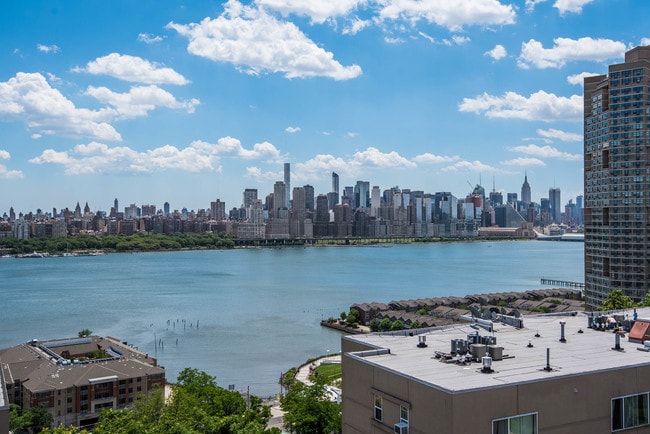
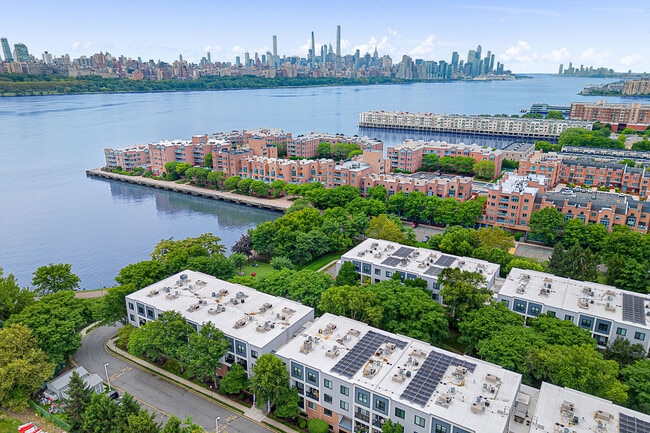
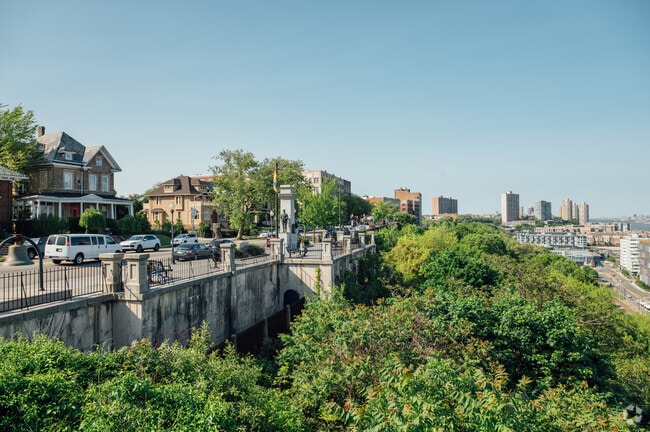
Situated on the other side of the Hudson River across from Manhattan, North Bergen exudes a laidback atmosphere plus convenient access to the hustle and bustle of one of the world’s most dynamic cities. The neighborhood rests atop the cliffs of Hudson Palisades, giving residents unbeatable views of the Manhattan skyline morning, noon, and night.
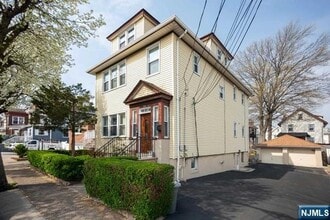
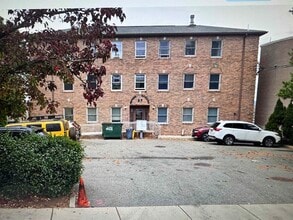
Proximity to the Big Apple means there’s seemingly endless rental opportunities. Single-family homes with quaint backyards share the street with relatively affordable apartment complexes. North Bergen remains a popular spot for families looking for extra space at a better price while still staying near the city.
Recreational opportunities are abundant in North Bergen — enjoy a bike ride along the trails, or walk the dog at James J. Braddock Park. Afterwards, relax and refuel at any one of North Bergen’s unique and tasty restaurants or bars. Pier 115 Bar and Grill or Haven are excellent choices for trendy fare on the water’s edge in a sophisticated and modern setting. With the Lincoln Tunnel located nearby, North Bergen is a great spot for commuters (or really anyone) looking for affordable accommodations near New York.
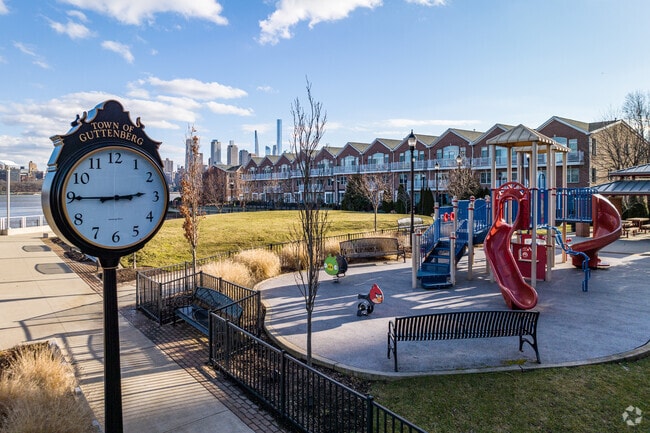
Parks in Guttenberg provide plenty of amenities for children to play and enjoy the outdoors.
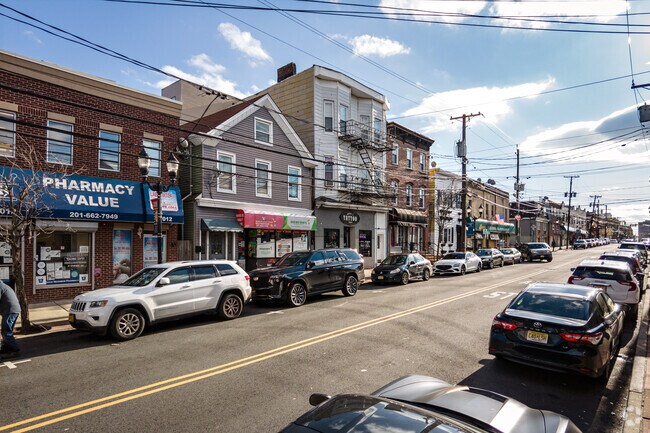
Guttenberg residents have easy access to many retail and dining options.
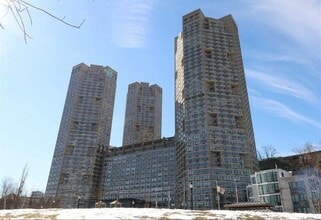
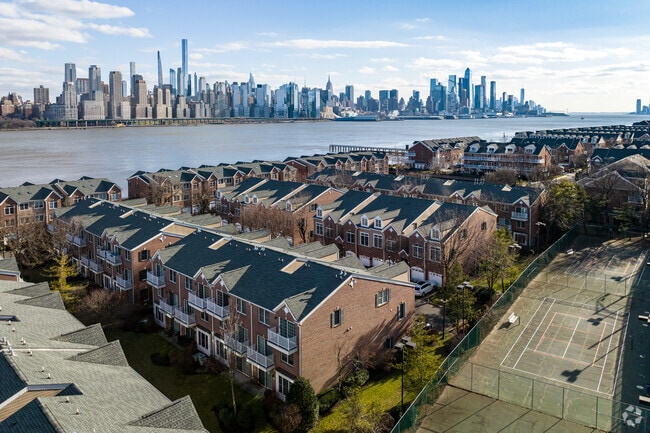
Boulevard East sits about 150 feet above the Hudson River and offers panoramic Manhattan views.
Single and multi-family Row homes are the standard in Clifton Park.
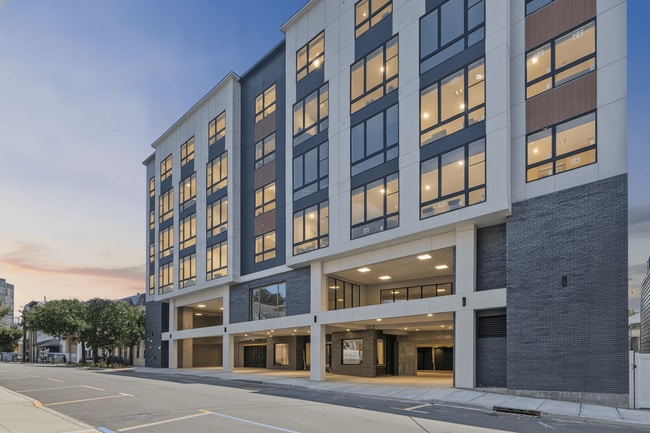
Newer apartment buildings are becoming more of a familiar sight in Clifton Park, like these on Park Ave.
Bergenline Avenue is the center of Clifton Park's vibrant Latin American community.
Median Household Income
$71,358
Average: $90,843
Education
16,017
Residents Have a Degree
Job Market
30,344
Workers Employed
Median Age
42 Years
Largest Age Group
30-39 Years
Approximately 14% of Residents
Under 20
21%
Over 65
19%
Housing Distribution
North Bergen has more renters than homeowners.

Education Distribution
Review this city's overall education levels.

As of August 2026, the average apartment rent in North Bergen, NJ is $2,238 for a studio, $2,479 for one bedroom, $3,239 for two bedrooms, and $6,276 for three bedrooms. Apartment rent in North Bergen has increased by 3.1% in the past year.
Explore how walkable, bikeable, drivable, and transit-friendly North Bergen, NJ is for everyday living.
Exceptionally Walkable
Walkability
Good Public Transit
Transit
Fairly Drivable
Drivability
Fairly Bikeable
Bikeability

Lincoln No. 5 Elementary School
Public
Grades PK-8
1,193 Students

Public
Grades K-8
938 Students
Franklin No. 3 Elementary School
Public
Grades K-8
533 Students
Horace Mann No. 9 Elementary School
Public
Grades K-8
978 Students

John F. Kennedy No. 7 Elementary School
Public
Grades K-8
576 Students
Lincoln No. 5 Elementary School
Public
Grades PK-8
1,193 Students
Public
Grades K-8
938 Students
Franklin No. 3 Elementary School
Public
Grades K-8
533 Students
Horace Mann No. 9 Elementary School
Public
Grades K-8
978 Students
John F. Kennedy No. 7 Elementary School
Public
Grades K-8
576 Students
Public
Grades 9-12
2,355 Students

Academy for Independent Studies
Public
Grades 9-12
140 Students
 The GreatSchools Rating helps parents compare schools within a state based on a variety of school quality indicators and provides a helpful picture of how effectively each school serves all of its students. Ratings are on a scale of 1 (below average) to 10 (above average) and can include test scores, college readiness, academic progress, advanced courses, equity, discipline and attendance data. We also advise parents to visit schools, consider other information on school performance and programs, and consider family needs as part of the school selection process.
View GreatSchools Rating Methodology
Data provided by
GreatSchools.org
© 2026. All rights reserved.
The GreatSchools Rating helps parents compare schools within a state based on a variety of school quality indicators and provides a helpful picture of how effectively each school serves all of its students. Ratings are on a scale of 1 (below average) to 10 (above average) and can include test scores, college readiness, academic progress, advanced courses, equity, discipline and attendance data. We also advise parents to visit schools, consider other information on school performance and programs, and consider family needs as part of the school selection process.
View GreatSchools Rating Methodology
Data provided by
GreatSchools.org
© 2026. All rights reserved.
† Our analysis of utilities, groceries, transportation, healthcare, home prices, and other goods and services is sourced from the Cost of Living Index, a respected benchmark published by the Council for Community and Economic Research (C2ER) that provides a thorough overview of living expenses across different regions.
Rent data is provided by CoStar Group’s Market Trend reports. As the industry leader in commercial real estate information, analytics, and news, CoStar conducts extensive research to produce and maintain a comprehensive database of commercial real estate information. We combine this data with public record to provide the most up-to-date rental information available.
Consumer goods, services, and home prices are sourced from the Cost of Living Index published by the Council for Community and Economic Research (C2ER). The data on this page is updated quarterly. It was last published in June 2026.
Demographic information comes from Neustar and combines detailed address data with U.S. Census and American Community Survey statistics to produce reliable local estimates.