Median Age
40 Years
Largest Age Group
30-39 Years
Approximately 15% of Residents
Under 20
23%
Over 65
19%


Avg Rent
$992
Population
39,425
Renter Mix
44% Rent
Just across the Ohio River from Downtown Louisville lies historic New Albany. Because of easy accessibility to Interstate 64 and a mild commute downtown, residents of New Albany have a direct line to all of Louisville’s amenities without the higher cost of living associated with city life.
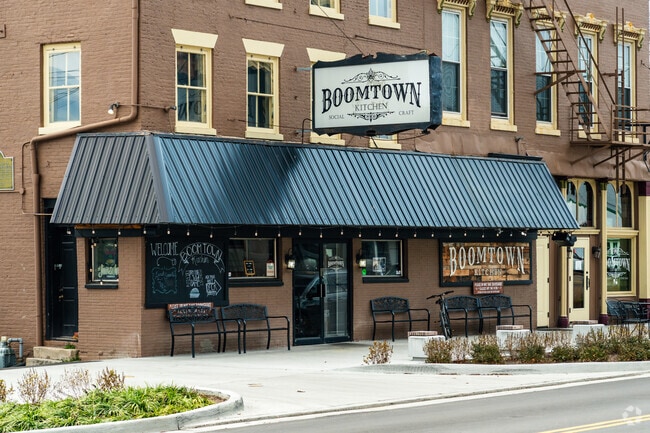
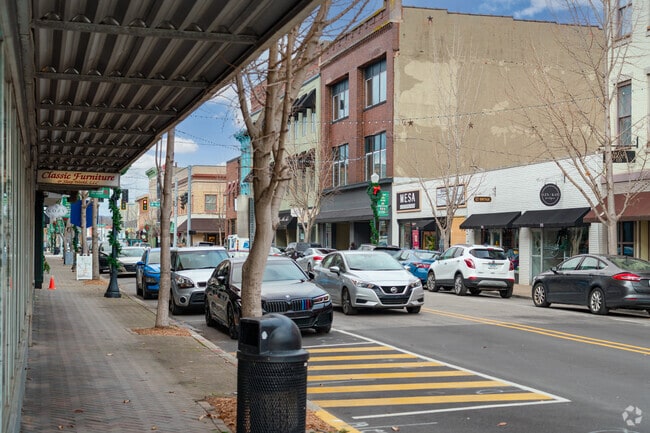
In addition to a sprawling park system, this Floyd County community is encompassed by a collection of 19th century homes and buildings. The Harvest Homecoming festival brings those near and far together for a day of celebration and fun. Located within city limits is the campus of Indiana University Southeast, along with excellent wineries, breweries, and restaurants.
New Albany likes to express its spirit through historical architecture and diverse murals.
The food at Boomtown Kitchen is some of the best in New Albany.
Median Household Income
$49,074
Average: $65,867
Education
8,563
Residents Have a Degree
Job Market
18,831
Workers Employed
Median Age
40 Years
Largest Age Group
30-39 Years
Approximately 15% of Residents
Under 20
23%
Over 65
19%
Housing Distribution
New Albany has more homeowners than renters.

Education Distribution
Review this city's overall education levels.

As of July 2026, the average apartment rent in New Albany, IN is $937 for a studio, $992 for one bedroom, $1,130 for two bedrooms, and $1,259 for three bedrooms. Apartment rent in New Albany has increased by 2.5% in the past year.
Explore how walkable, bikeable, drivable, and transit-friendly New Albany, IN is for everyday living.
Fairly Walkable
Walkability
Limited Public Transit
Transit
Exceptionally Drivable
Drivability
Fairly Bikeable
Bikeability
Public
Grades PK-5
513 Students

Public
Grades PK-5
405 Students
Public
Grades PK-12
487 Students

S Ellen Jones Elementary School
Public
Grades PK-5
243 Students
Nathaniel Scribner Middle School
Public
Grades K-8
941 Students

Public
Grades PK-12
487 Students
Nathaniel Scribner Middle School
Public
Grades K-8
941 Students
Public
Grades K-8
798 Students

Public
Grades 9-12
1,821 Students
Public
Grades PK-12
487 Students
† Our analysis of utilities, groceries, transportation, healthcare, home prices, and other goods and services is sourced from the Cost of Living Index, a respected benchmark published by the Council for Community and Economic Research (C2ER) that provides a thorough overview of living expenses across different regions.
Rent data is provided by CoStar Group’s Market Trend reports. As the industry leader in commercial real estate information, analytics, and news, CoStar conducts extensive research to produce and maintain a comprehensive database of commercial real estate information. We combine this data with public record to provide the most up-to-date rental information available.
Consumer goods, services, and home prices are sourced from the Cost of Living Index published by the Council for Community and Economic Research (C2ER). The data on this page is updated quarterly. It was last published in June 2026.
Demographic information comes from Neustar and combines detailed address data with U.S. Census and American Community Survey statistics to produce reliable local estimates.


