Median Age
37 Years
Largest Age Group
25-34 Years
Approximately 15% of Residents
Under 20
25%
Over 65
16%




Avg Rent
$1,684
Population
54,970
Renter Mix
67% Rent
National City is a great place to live – it provides all the necessities combined with the comforts of home! Its affordability makes it an ideal choice for people who seek the conveniences of San Diego without breaking the bank.
The city is just north of Chula Vista and encompassed by two wildlife refuges. There are several parks in the community that are perfect for family-friendly activities. Celebrations, carnivals, and the National City Automobile Heritage Car Show help bring this diverse community together.
From shopping malls like Westfield Plaza Bonita to the auto mall at Mile of Cars, National City continues to thrive for its residents. Residents appreciate the direct access to Interstate 5 and Interstate 805.
The Metropolitan Transit System (MTS) offers service in National City
National City’s Mile of Cars began when the first car arrived in the city in 1904
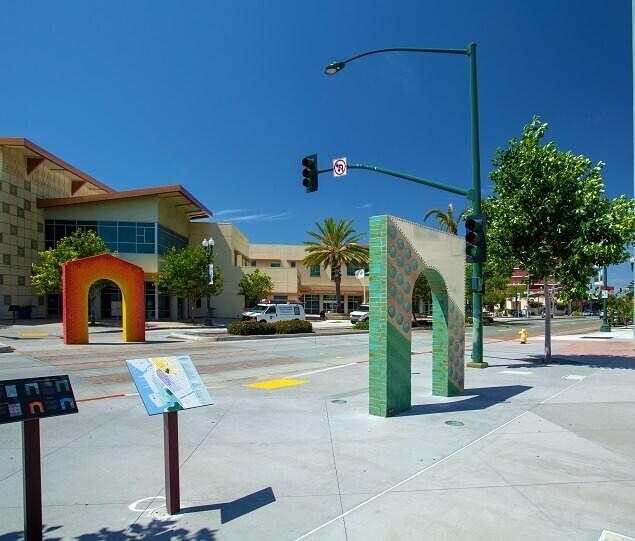
Mosaic arches add a quirky, artistic element to Morgan Square Plaza
The 5.5-acre Pepper Park offers a fishing pier, a boat launch, and a playground
The state-of-the-art Pier 32 Marina is a favorite destination for area boaters
Residents enjoy fast access to shopping destinations like South Bay Plaza
Median Household Income
$56,851
Average: $72,120
Education
9,235
Residents Have a Degree
Job Market
25,143
Workers Employed
Median Age
37 Years
Largest Age Group
25-34 Years
Approximately 15% of Residents
Under 20
25%
Over 65
16%
Housing Distribution
National City has more renters than homeowners.

Education Distribution
Review this city's overall education levels.

As of August 2026, the average apartment rent in National City, CA is $1,656 for a studio, $1,685 for one bedroom, $2,206 for two bedrooms, and $2,896 for three bedrooms. Apartment rent in National City has increased by 0.2% in the past year.
Explore how walkable, bikeable, drivable, and transit-friendly National City, CA is for everyday living.
Moderately Walkable
Walkability
Some Public Transit
Transit
Exceptionally Drivable
Drivability
Fairly Bikeable
Bikeability

Public
Grades K-5
393 Students

John A. Otis Elementary School
Public
Grades K-5
367 Students
Public
Grades K-5
477 Students

Public
Grades K-5
477 Students
Public
Grades K-5
458 Students
Public
Grades 6-8
724 Students
Public
Grades 6-8
709 Students
Public
Grades K-8
393 Students

Public
Grades 9-12
2,290 Students
Public
Grades 9-12
2,290 Students
San Diego Workforce Innovation High
Public
Grades 9-12
2,722 Students

 The GreatSchools Rating helps parents compare schools within a state based on a variety of school quality indicators and provides a helpful picture of how effectively each school serves all of its students. Ratings are on a scale of 1 (below average) to 10 (above average) and can include test scores, college readiness, academic progress, advanced courses, equity, discipline and attendance data. We also advise parents to visit schools, consider other information on school performance and programs, and consider family needs as part of the school selection process.
View GreatSchools Rating Methodology
Data provided by
GreatSchools.org
© 2026. All rights reserved.
The GreatSchools Rating helps parents compare schools within a state based on a variety of school quality indicators and provides a helpful picture of how effectively each school serves all of its students. Ratings are on a scale of 1 (below average) to 10 (above average) and can include test scores, college readiness, academic progress, advanced courses, equity, discipline and attendance data. We also advise parents to visit schools, consider other information on school performance and programs, and consider family needs as part of the school selection process.
View GreatSchools Rating Methodology
Data provided by
GreatSchools.org
© 2026. All rights reserved.
† Our analysis of utilities, groceries, transportation, healthcare, home prices, and other goods and services is sourced from the Cost of Living Index, a respected benchmark published by the Council for Community and Economic Research (C2ER) that provides a thorough overview of living expenses across different regions.
Rent data is provided by CoStar Group’s Market Trend reports. As the industry leader in commercial real estate information, analytics, and news, CoStar conducts extensive research to produce and maintain a comprehensive database of commercial real estate information. We combine this data with public record to provide the most up-to-date rental information available.
Consumer goods, services, and home prices are sourced from the Cost of Living Index published by the Council for Community and Economic Research (C2ER). The data on this page is updated quarterly. It was last published in June 2026.
Demographic information comes from Neustar and combines detailed address data with U.S. Census and American Community Survey statistics to produce reliable local estimates.