Median Age
32 Years
Largest Age Group
20-29 Years
Approximately 25% of Residents
Under 20
22%
Over 65
16%

Avg Rent
$805
Population
68,662
Renter Mix
51% Rent
Muncie sits about an hour northeast of Indianapolis, where the energy of a Division I college town meets the grounded pace of East Central Indiana. Ball State University anchors much of the city's cultural life, drawing people to live music, art shows, and Cardinal football Saturdays that turn the whole city into a sea of red. Downtown along Walnut Street, you'll find a lively stretch of restaurants, shops, and entertainment venues that buzz well beyond game days. Outdoors, Prairie Creek Reservoir offers hiking trails, boating, and fishing just a short drive from the city center. The area traces its roots to a Lenape village called Munsee Town, established along the White River in the 1790s, giving Muncie a deep sense of place that goes well beyond its university identity. The rental market here offers real variety, from cozy studio apartments to spacious townhomes, with newer apartment communities scattered across the city alongside character-filled older buildings closer to campus. Renters get a lot of square footage for their dollar compared to larger Indiana cities, making Muncie an appealing option for those who want comfort without stretching a budget.
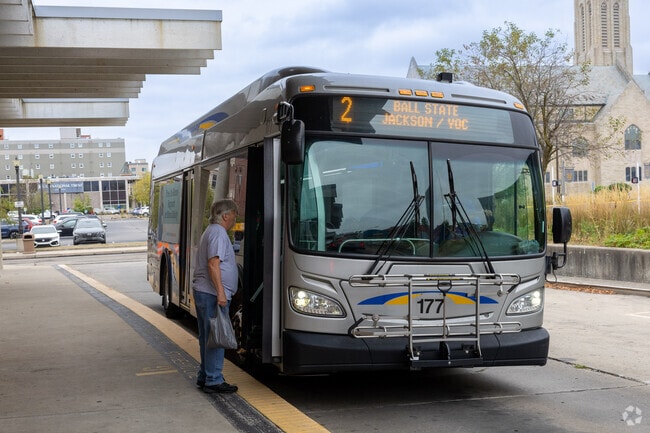
The buses run frequently near East Central.
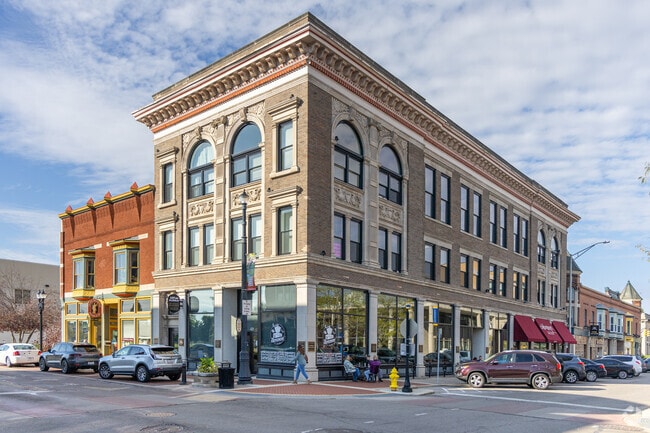
The Caffeinery is located in a historic building along Walnut St. in Downtown Muncie.
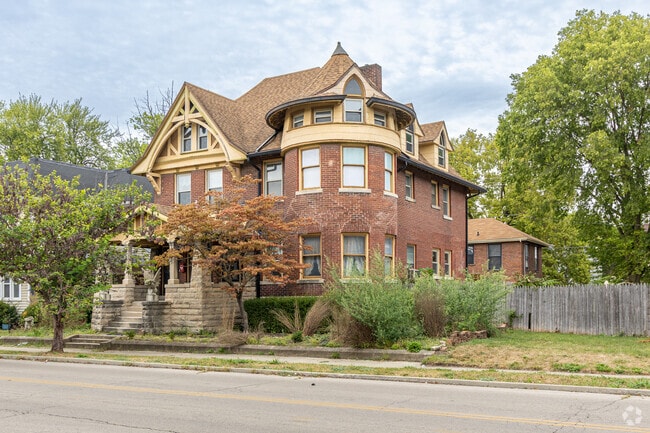
Here's a brick Victorian styled home located near the Downtown Muncie area.
A row of traditional single family homes found around the Downtown Munice area.
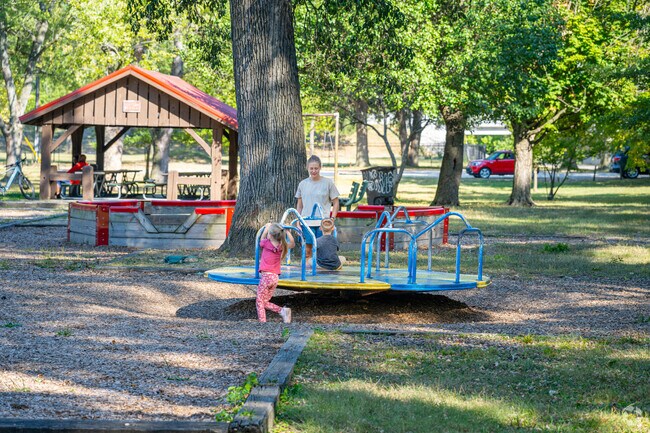
There are several historical homes and buildings at Heekin Park in Muncie, IN.
This is a unique top down look at Muncie Memory Spiral at the Heekin Park in Muncie, IN.
Median Household Income
$41,276
Average: $53,670
Education
15,148
Residents Have a Degree
Job Market
31,052
Workers Employed
Median Age
32 Years
Largest Age Group
20-29 Years
Approximately 25% of Residents
Under 20
22%
Over 65
16%
Housing Distribution
Muncie has more renters than homeowners.

Education Distribution
Review this city's overall education levels.

As of July 2026, the average apartment rent in Muncie, IN is $653 for a studio, $805 for one bedroom, $962 for two bedrooms, and $1,184 for three bedrooms. Apartment rent in Muncie has increased by 1.1% in the past year.
The cost of living in Muncie, IN is 9.0% lower than the national average. Generally, housing in Muncie is 17.4% less expensive than the national average, with rent falling between $653 - $1,184. You can expect to pay 5.8% less for groceries, 2.5% less for utilities, and 0.7% less for transportation.
Compare Cities
Explore how walkable, bikeable, drivable, and transit-friendly Muncie, IN is for everyday living.
Moderately Walkable
Walkability
Good Public Transit
Transit
Moderately Drivable
Drivability
Moderately Bikeable
Bikeability
Public
Grades K-12
681 Students

Public
Grades K-5
596 Students
Public
Grades PK-5
492 Students
Public
Grades PK-5
384 Students
Public
Grades K-5
429 Students

Public
Grades K-12
681 Students
Public
Grades 6-8
633 Students
Public
Grades 6-12
318 Students
Public
Grades 6-8
630 Students

Public
Grades PK-12
1,337 Students

Indiana Academy For Science, Math & Humanities
Public
Grades 9-12
218 Students

Public
Grades 9-12
848 Students

Public
Grades K-12
681 Students
Public
Grades 6-12
318 Students
Public
Grades PK-12
1,337 Students
† Our analysis of utilities, groceries, transportation, healthcare, home prices, and other goods and services is sourced from the Cost of Living Index, a respected benchmark published by the Council for Community and Economic Research (C2ER) that provides a thorough overview of living expenses across different regions.
Rent data is provided by CoStar Group’s Market Trend reports. As the industry leader in commercial real estate information, analytics, and news, CoStar conducts extensive research to produce and maintain a comprehensive database of commercial real estate information. We combine this data with public record to provide the most up-to-date rental information available.
Consumer goods, services, and home prices are sourced from the Cost of Living Index published by the Council for Community and Economic Research (C2ER). The data on this page is updated quarterly. It was last published in June 2026.
Demographic information comes from Neustar and combines detailed address data with U.S. Census and American Community Survey statistics to produce reliable local estimates.


