Median Age
45 Years
Largest Age Group
50-59 Years
Approximately 15% of Residents
Under 20
23%
Over 65
21%

Avg Rent
$2,807
Population
9,835
Renter Mix
18% Rent
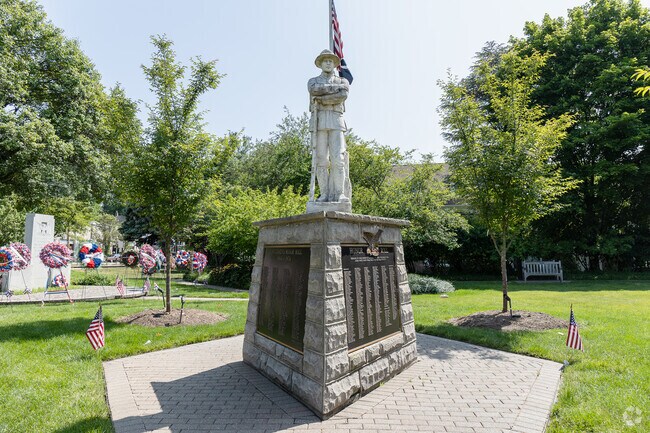
Montvale is a borough in Bergen County. The area is suburban and sits right along the New York and New Jersey borders. This tiny town offers a children’s park with swings, climbing objects, and other activities. The park has tennis courts for adults available as well. Montvale is quiet for the majority of the year but they do host a few events. The annual Montvale Street Festival and Craft Show is a neighborhood favorite with kiddie rides, face painting, games, and more.
Montvale’s location offers quick access to both New Jersey and New York activities. Travel less than 30 minutes into New York and get a history lesson the Holocaust Museum & Center for Tolerance and Education in Ramapao. Montvale is only 40 minutes from Newark, giving convenient access to top attractions including the New Jersey Performing Arts Center, Rutgers University, and Newark Museum.
The Shoppes at DePiero Farm in Montvale extend retail options for residents.
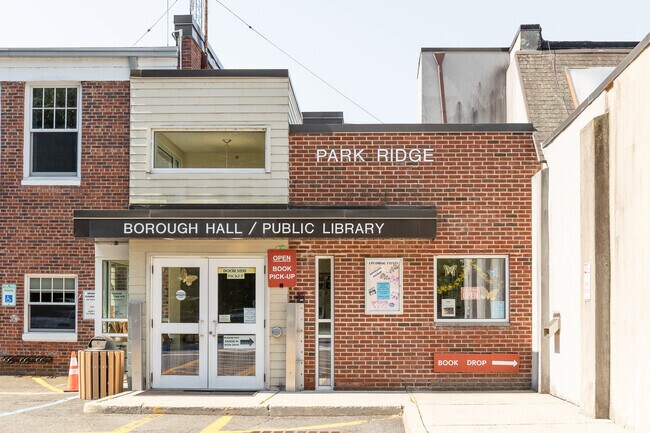
Park Ridge Borough Hall is a great place to rent a book in Montvale.
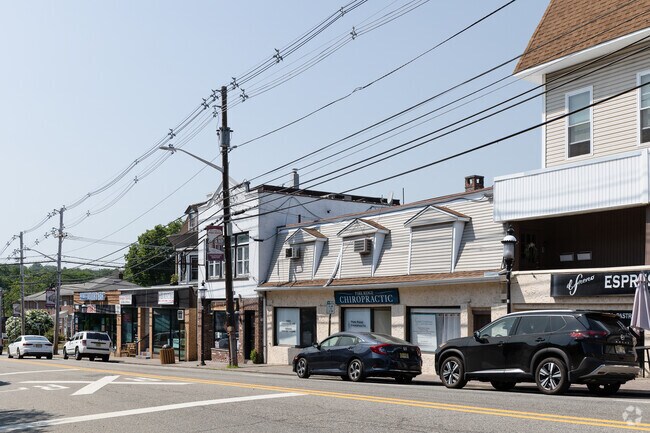
Shops on Park Avenue in Montvale make running errands a breeze.
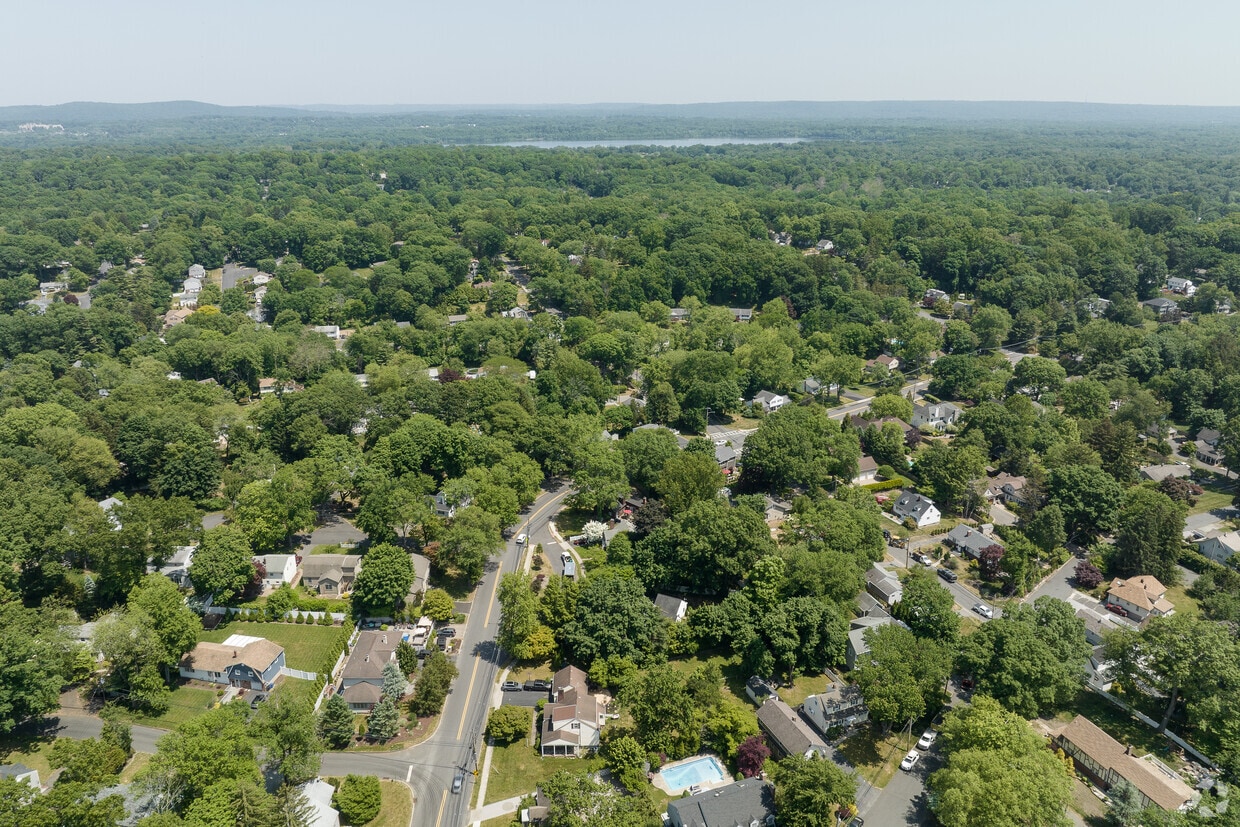
Colonial-style houses can be found on tree-lined streets in Montvale.
Downtown Montvale is a major thoroughfare.
Homes in Montvale often have large yards.
Median Household Income
$152,023
Average: $169,760
Education
4,469
Residents Have a Degree
Job Market
5,232
Workers Employed
Median Age
45 Years
Largest Age Group
50-59 Years
Approximately 15% of Residents
Under 20
23%
Over 65
21%
Housing Distribution
Montvale has more homeowners than renters.

Education Distribution
Review this city's overall education levels.

As of July 2026, the average apartment rent in Montvale, NJ is $2,819 for one bedroom, $4,562 for two bedrooms, and $5,295 for three bedrooms. Apartment rent in Montvale has increased by 1.3% in the past year.
Explore how walkable, bikeable, drivable, and transit-friendly Montvale, NJ is for everyday living.
Fairly Walkable
Walkability
Minimal Public Transit
Transit
Very Drivable
Drivability
Somewhat Bikeable
Bikeability
Public
Grades K-8
433 Students

Public
Grades PK-5
517 Students

Public
Grades K-8
433 Students
Public
Grades 9-12
788 Students

† Our analysis of utilities, groceries, transportation, healthcare, home prices, and other goods and services is sourced from the Cost of Living Index, a respected benchmark published by the Council for Community and Economic Research (C2ER) that provides a thorough overview of living expenses across different regions.
Rent data is provided by CoStar Group’s Market Trend reports. As the industry leader in commercial real estate information, analytics, and news, CoStar conducts extensive research to produce and maintain a comprehensive database of commercial real estate information. We combine this data with public record to provide the most up-to-date rental information available.
Consumer goods, services, and home prices are sourced from the Cost of Living Index published by the Council for Community and Economic Research (C2ER). The data on this page is updated quarterly. It was last published in June 2026.
Demographic information comes from Neustar and combines detailed address data with U.S. Census and American Community Survey statistics to produce reliable local estimates.


