Median Age
38 Years
Largest Age Group
25-34 Years
Approximately 15% of Residents
Under 20
24%
Over 65
18%


Avg Rent
$1,130
Population
51,799
Renter Mix
49% Rent
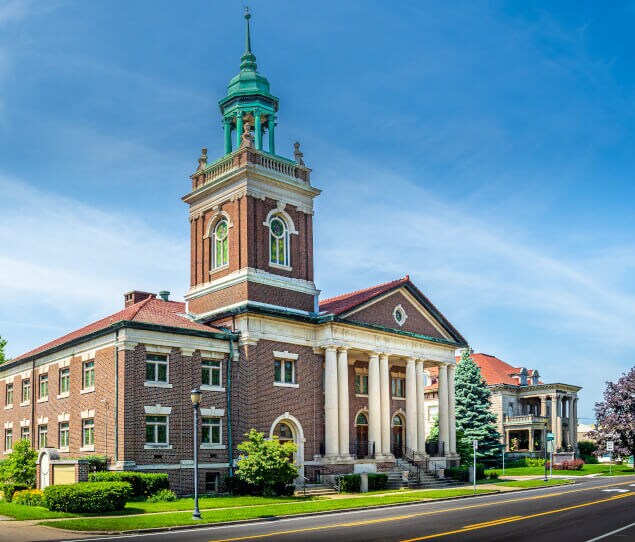
Mishawaka sits along the St. Joseph River in northern Indiana, earning the nickname "the Princess City" — a nod to its roots in Shawnee legend and the kind of civic pride that still shows up in well-kept parks and a lively downtown. The city shares a metropolitan area with South Bend to the west, giving residents access to a larger urban core while holding onto a character all its own. Major employers like AM General and several healthcare institutions anchor the local economy, and the University of Notre Dame is just minutes away, lending an academic and cultural energy to the region.
Neighborhoods here range from the walkable streets near downtown — where the Riverwalk traces the riverbank through Beutter and Battell parks — to quieter residential stretches further out. The housing mix reflects that range, with apartment communities offering everything from ground-level units in low-rise settings to more spacious layouts suited for those who want extra room. Renters looking for accessible Midwest living without sacrificing proximity to a metro area will find Mishawaka to be a grounded, well-rounded place to call home.
Median Household Income
$52,168
Average: $67,537
Education
11,957
Residents Have a Degree
Job Market
26,629
Workers Employed
Median Age
38 Years
Largest Age Group
25-34 Years
Approximately 15% of Residents
Under 20
24%
Over 65
18%
Housing Distribution
In Mishawaka, there are roughly the same number of renters and homeowners.

Education Distribution
Review this city's overall education levels.

As of July 2026, the average apartment rent in Mishawaka, IN is $1,126 for a studio, $1,135 for one bedroom, $1,336 for two bedrooms, and $1,864 for three bedrooms. Apartment rent in Mishawaka has decreased by -5.8% in the past year.
Explore how walkable, bikeable, drivable, and transit-friendly Mishawaka, IN is for everyday living.
Fairly Walkable
Walkability
Exceptionally Drivable
Drivability
Fairly Bikeable
Bikeability
Public
Grades PK-5
494 Students

Public
Grades K-5
327 Students
Public
Grades PK-5
503 Students

Elsie Rogers Elementary School
Public
Grades PK-5
361 Students
Public
Grades K-5
300 Students
Public
Grades 6-8
1,004 Students
Virgil I Grissom Middle School
Public
Grades 6-8
662 Students

Public
Grades 6-8
709 Students

Public
Grades K-12
44 Students

Public
Grades 9-12
3,624 Students

Public
Grades 9-12
1,327 Students

Public
Grades K-12
44 Students
† Our analysis of utilities, groceries, transportation, healthcare, home prices, and other goods and services is sourced from the Cost of Living Index, a respected benchmark published by the Council for Community and Economic Research (C2ER) that provides a thorough overview of living expenses across different regions.
Rent data is provided by CoStar Group’s Market Trend reports. As the industry leader in commercial real estate information, analytics, and news, CoStar conducts extensive research to produce and maintain a comprehensive database of commercial real estate information. We combine this data with public record to provide the most up-to-date rental information available.
Consumer goods, services, and home prices are sourced from the Cost of Living Index published by the Council for Community and Economic Research (C2ER). The data on this page is updated quarterly. It was last published in June 2026.
Demographic information comes from Neustar and combines detailed address data with U.S. Census and American Community Survey statistics to produce reliable local estimates.


