Median Age
41 Years
Largest Age Group
30-39 Years
Approximately 14% of Residents
Under 20
23%
Over 65
21%
Avg Rent
$929
Population
42,891
Renter Mix
34% Rent
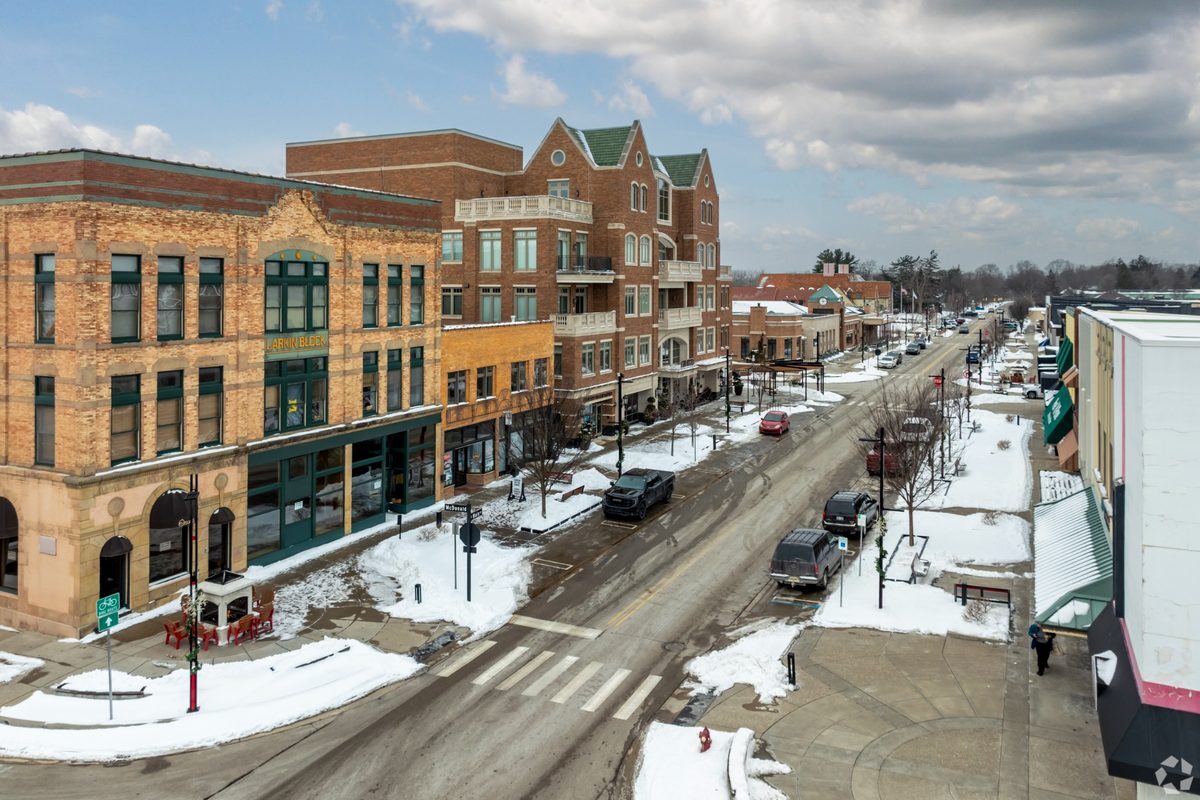
Midland anchors the western point of Michigan’s Tri-Cities triangle, connecting to Bay City and Saginaw while maintaining its distinct identity shaped by Dow Chemical Company’s 1897 founding. Downtown Main Street pulses with specialty shops, local restaurants, and a farmers’ market along the Tittabawassee River. The Tridge, a three-way footbridge where river channels meet, links downtown to Towsley Dike and Chippewassee Parks, making it easy to go from coffee shops to riverside trails in minutes. Northwood University adds academic presence and keeps the arts calendar stocked year-round.
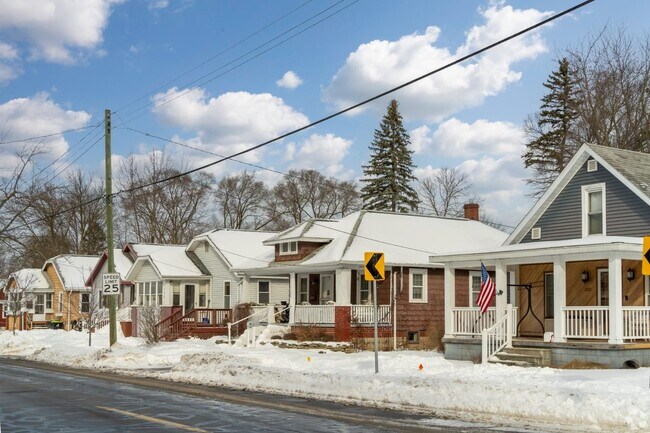
Renters find diverse options, from cozy apartments in tree-lined neighborhoods to spacious townhomes near golf courses and green spaces. The rental market offers better accessibility than larger Michigan metros, delivering solid value without sacrificing comfort. Studios, one-bedrooms, and multi-bedroom layouts provide flexibility for those putting down roots or just getting started.
Median Household Income
$68,384
Average: $97,659
Education
15,868
Residents Have a Degree
Job Market
20,294
Workers Employed
Median Age
41 Years
Largest Age Group
30-39 Years
Approximately 14% of Residents
Under 20
23%
Over 65
21%
Housing Distribution
Midland has more homeowners than renters.

Education Distribution
Review this city's overall education levels.

As of July 2026, the average apartment rent in Midland, MI is $634 for a studio, $934 for one bedroom, $1,184 for two bedrooms, and $1,437 for three bedrooms. Apartment rent in Midland has decreased by -0.8% in the past year.
Explore how walkable, bikeable, drivable, and transit-friendly Midland, MI is for everyday living.
Fairly Walkable
Walkability
Very Drivable
Drivability
Moderately Bikeable
Bikeability
Public
Grades K-5
589 Students

Public
Grades K-5
489 Students

Public
Grades K-5
642 Students

Public
Grades PK-5
292 Students
Public
Grades K-5
263 Students
Public
Grades 6-8
863 Students
Public
Grades 6-8
794 Students
Public
Grades 6-8
374 Students

Mcesa And Sugnet School Classroom Programs
Public
Grades PK-12
201 Students

Public
Grades 9-12
1,246 Students
Public
Grades 9-12
1,105 Students
Public
Grades 9-12
439 Students
Public
Grades 9-12
86 Students

Mcesa And Sugnet School Classroom Programs
Public
Grades PK-12
201 Students
† Our analysis of utilities, groceries, transportation, healthcare, home prices, and other goods and services is sourced from the Cost of Living Index, a respected benchmark published by the Council for Community and Economic Research (C2ER) that provides a thorough overview of living expenses across different regions.
Rent data is provided by CoStar Group’s Market Trend reports. As the industry leader in commercial real estate information, analytics, and news, CoStar conducts extensive research to produce and maintain a comprehensive database of commercial real estate information. We combine this data with public record to provide the most up-to-date rental information available.
Consumer goods, services, and home prices are sourced from the Cost of Living Index published by the Council for Community and Economic Research (C2ER). The data on this page is updated quarterly. It was last published in June 2026.
Demographic information comes from Neustar and combines detailed address data with U.S. Census and American Community Survey statistics to produce reliable local estimates.


