Median Age
41 Years
Largest Age Group
40-49 Years
Approximately 14% of Residents
Under 20
24%
Over 65
16%


Avg Rent
$1,946
Population
26,020
Renter Mix
16% Rent
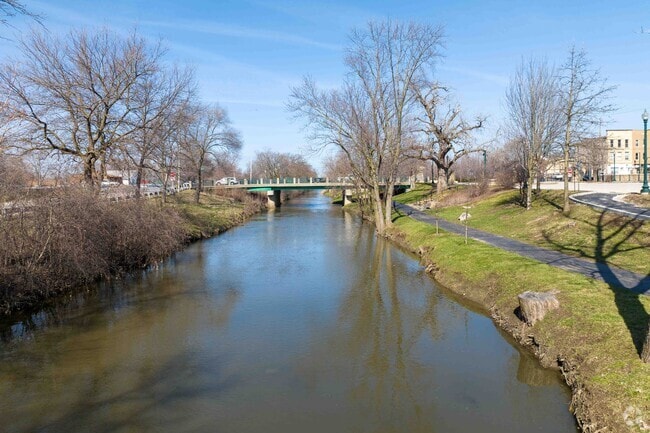
A product of a population and development boom that occurred during the construction of the Illinois & Michigan Canal, Lockport is still one of the best-preserved canal sites in the country. The Desk Plaines River runs along the west bank of the city, and while it made Lockport a hub of industry years ago, today the city has become known for its pristine parks and family-friendly vibe.
State St. and 9th St. have the largest collection of Lockport’s attractions. Tap houses, restaurants, and niche spots like Amazing Fantasy Books & Comics keep the canal-side district full of energy. As you move farther east there’s more recognizable stores and fast food restaurants, but there’s also plenty of parks and Broken Arrow Golf Club.
Whether you’re looking for an apartment with riverfront views, or a more traditional home and a two-car garage, Lockport has something for every renter. Families will appreciate the top-notch schools, and the commuting crowd will appreciate the proximity to Chicago and nearby I-355.
Walking paths along the river in Lockport.
The Illinois and Michigan Canal Trail has over 7 miles of trails.
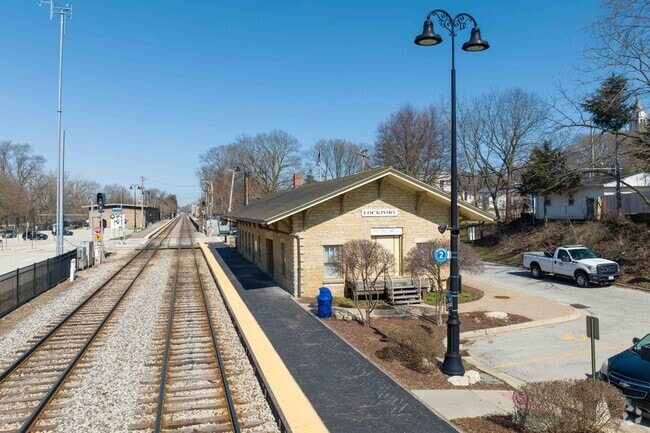
Residents can reach Chicago in under an hour from the Lockport Metra Station.
Lockport Gallery and Betsey’s Yarn and Tea Shop are in the same building.
Residents can enjoy miles of hiking trails year-round.
Cruisin' into Lockport is a summer car show held weekly on Monday nights.
Median Household Income
$94,828
Average: $113,549
Education
8,131
Residents Have a Degree
Job Market
14,372
Workers Employed
Median Age
41 Years
Largest Age Group
40-49 Years
Approximately 14% of Residents
Under 20
24%
Over 65
16%
Housing Distribution
Lockport has more homeowners than renters.

Education Distribution
Review this city's overall education levels.

As of July 2026, the average apartment rent in Lockport, IL is $1,569 for a studio, $1,946 for one bedroom, $2,321 for two bedrooms, and $2,786 for three bedrooms. Apartment rent in Lockport has increased by 6.6% in the past year.
Explore how walkable, bikeable, drivable, and transit-friendly Lockport, IL is for everyday living.
Fairly Walkable
Walkability
Limited Public Transit
Transit
Exceptionally Drivable
Drivability
Not Bikeable
Bikeability
Public
Grades K-5
553 Students

Public
Grades PK-5
217 Students
Public
Grades K-8
286 Students

Public
Grades K-5
315 Students

Public
Grades PK-8
270 Students
Public
Grades K-8
286 Students
Public
Grades PK-8
270 Students
Public
Grades PK-8
277 Students

Lockport Township High School East
Public
Grades 9-12
3,638 Students

† Our analysis of utilities, groceries, transportation, healthcare, home prices, and other goods and services is sourced from the Cost of Living Index, a respected benchmark published by the Council for Community and Economic Research (C2ER) that provides a thorough overview of living expenses across different regions.
Rent data is provided by CoStar Group’s Market Trend reports. As the industry leader in commercial real estate information, analytics, and news, CoStar conducts extensive research to produce and maintain a comprehensive database of commercial real estate information. We combine this data with public record to provide the most up-to-date rental information available.
Consumer goods, services, and home prices are sourced from the Cost of Living Index published by the Council for Community and Economic Research (C2ER). The data on this page is updated quarterly. It was last published in June 2026.
Demographic information comes from Neustar and combines detailed address data with U.S. Census and American Community Survey statistics to produce reliable local estimates.


