Median Age
39 Years
Largest Age Group
30-39 Years
Approximately 15% of Residents
Under 20
24%
Over 65
17%
Avg Rent
$1,139
Population
16,075
Renter Mix
38% Rent
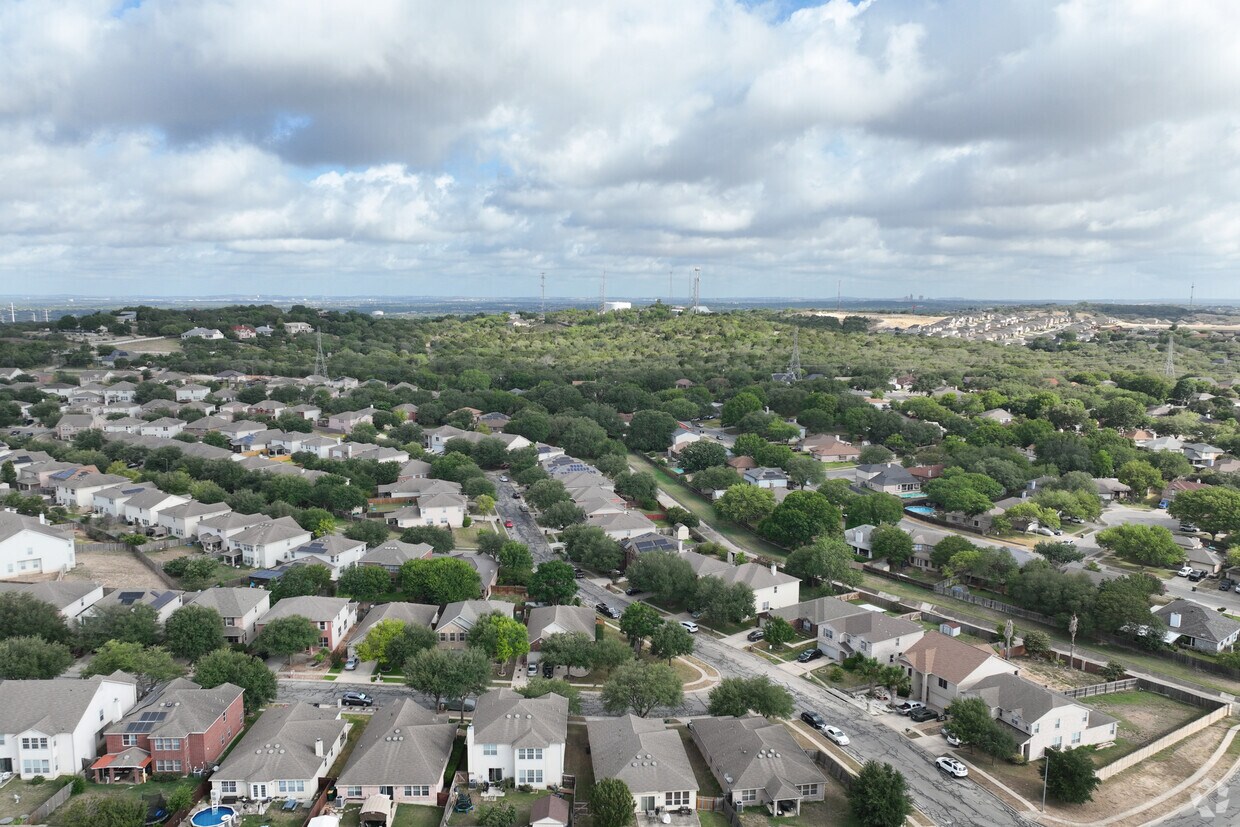
Located just 15 miles northeast of Downtown San Antonio, Live Oak is a tranquil suburb convenient to a variety of major amenities. Live Oak sits at the intersection of I-35 and Loop 1604, minutes from San Antonio International Airport, so getting around from the city is a breeze.
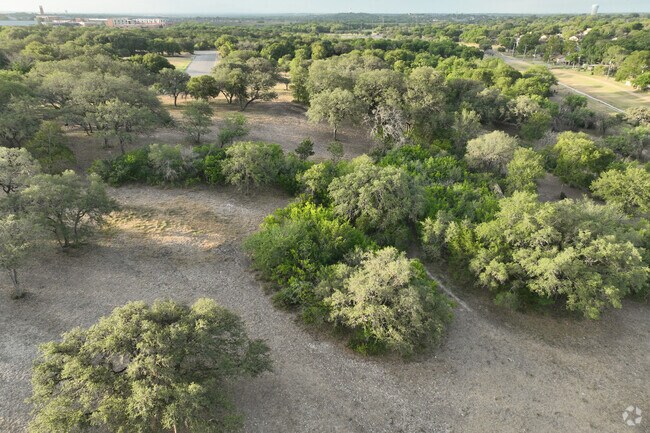
While Live Oak is predominantly a residential area, it also contains multiple in-town parks and a range of shopping opportunities. Popular spots for outdoor activities include Live Oak’s Main City Park and Woodcrest Park as well as nearby McAllister Park and Natural Bridge Caverns. Retail delights abound at Live Oak’s many shopping centers, the Forum at Olympia Parkway, and North Star Mall. Family-friendly attractions like Morgan’s Wonderland and the San Antonio Zoo are just minutes from Live Oak. Randolph Air Force Base and Fort Sam Houston are close to Live Oak as well.
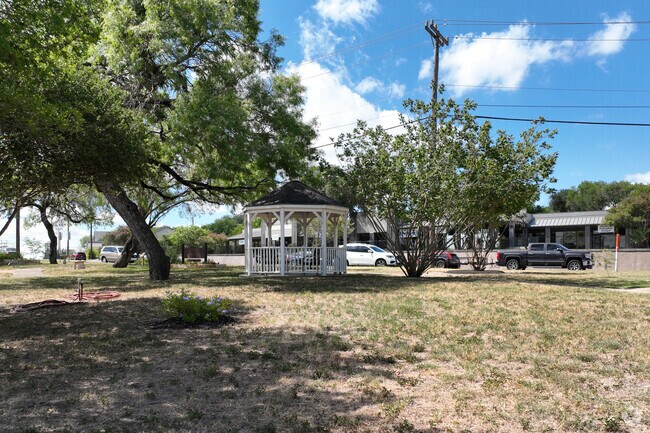
Residents of Live Oak can relax at the community garden and pavilion.
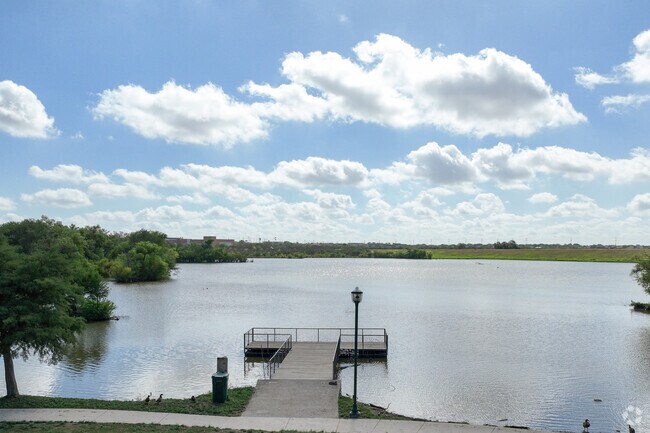
Locals often fish from the pier at Live Oak Lake.
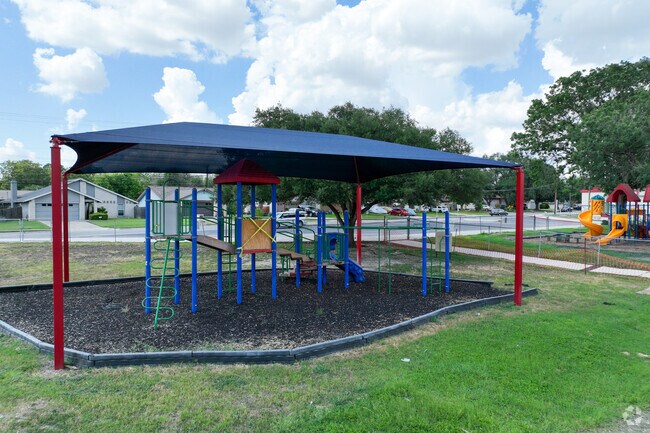
Crestview Playground provides a shady place to play in Live Oak.
Live Oak Community Pool helps residents stay cool during the hotter months.
A row of masonry-finished homes in Live Oak highlights the neighborhood's architectural style.
Cast a line, launch a boat, or just relax off the bank of Live Oak Lake.
Median Household Income
$73,907
Average: $90,900
Education
3,855
Residents Have a Degree
Job Market
8,552
Workers Employed
Median Age
39 Years
Largest Age Group
30-39 Years
Approximately 15% of Residents
Under 20
24%
Over 65
17%
Housing Distribution
Live Oak has more homeowners than renters.

Education Distribution
Review this city's overall education levels.

As of July 2026, the average apartment rent in Live Oak, TX is $1,139 for one bedroom, $1,385 for two bedrooms, and $1,691 for three bedrooms. Apartment rent in Live Oak has increased by 0.1% in the past year.
Explore how walkable, bikeable, drivable, and transit-friendly Live Oak, TX is for everyday living.
Fairly Walkable
Walkability
Exceptionally Drivable
Drivability
Fairly Bikeable
Bikeability
Public
Grades 9-12
438 Students

† Our analysis of utilities, groceries, transportation, healthcare, home prices, and other goods and services is sourced from the Cost of Living Index, a respected benchmark published by the Council for Community and Economic Research (C2ER) that provides a thorough overview of living expenses across different regions.
Rent data is provided by CoStar Group’s Market Trend reports. As the industry leader in commercial real estate information, analytics, and news, CoStar conducts extensive research to produce and maintain a comprehensive database of commercial real estate information. We combine this data with public record to provide the most up-to-date rental information available.
Consumer goods, services, and home prices are sourced from the Cost of Living Index published by the Council for Community and Economic Research (C2ER). The data on this page is updated quarterly. It was last published in June 2026.
Demographic information comes from Neustar and combines detailed address data with U.S. Census and American Community Survey statistics to produce reliable local estimates.


