

Median Age
35 Years
Largest Age Group
25-34 Years
Approximately 17% of Residents
Under 20
25%
Over 65
15%


Avg Rent
$1,031
Population
114,204
Renter Mix
50% Rent
Living in Lansing, Michigan combines state government energy, educational opportunities, and local culture in the heart of the Great Lakes State. The State Capitol building anchors the downtown area, while the Grand River and Red Cedar River frame the extensive Lansing River Trail system. Michigan State University in neighboring East Lansing enhances the area with its academic presence and Big Ten sporting events. The rental market currently shows moderate growth, with average rents ranging from $859 for studios to $1,660 for four-bedroom units, and an overall average rent of $981 showing a 3.1% annual increase.
Lansing's neighborhoods each offer distinct character, from Old Town's historic architecture and art galleries to the established Eastside neighborhood. REO Town, named after auto pioneer Ransom Eli Olds, showcases the city's automotive heritage through its architecture and museums. Outdoor spaces include the 102-acre Potter Park Zoo and the extensive river trail network. Housing options span from downtown apartments to homes in residential areas. Local landmarks include the Impression 5 Science Center, the R.E. Olds Transportation Museum, and the Michigan State Capitol, which welcomes visitors with its restored hand-painted ceilings and Victorian-era architecture. The city's event calendar features the Common Ground Music Festival and Silver Bells in the City, a holiday celebration that illuminates downtown each November.
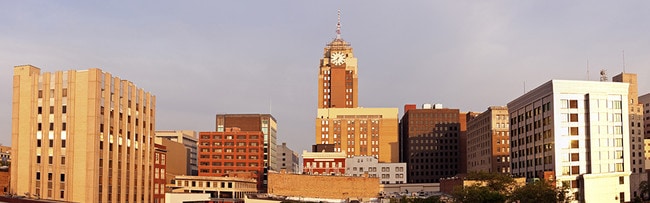
The Lansing skyline
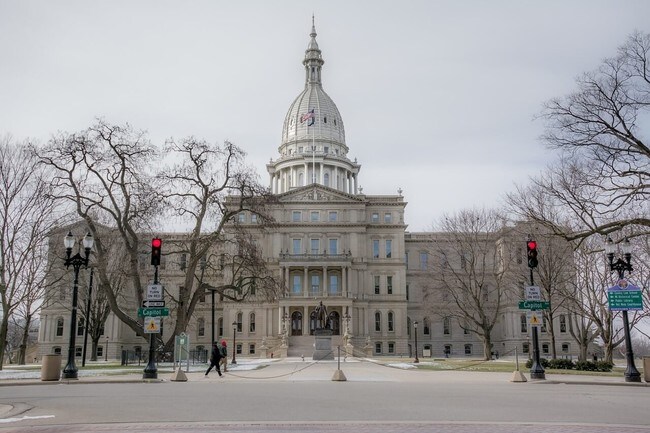
The Michigan State Capitol was built in 1872
Median Household Income
$47,516
Average: $60,084
Education
28,184
Residents Have a Degree
Job Market
57,676
Workers Employed
Median Age
35 Years
Largest Age Group
25-34 Years
Approximately 17% of Residents
Under 20
25%
Over 65
15%
Housing Distribution
In Lansing, there are roughly the same number of renters and homeowners.

Education Distribution
Review this city's overall education levels.

As of July 2026, the average apartment rent in Lansing, MI is $918 for a studio, $1,031 for one bedroom, $1,255 for two bedrooms, and $1,568 for three bedrooms. Apartment rent in Lansing has increased by 1.2% in the past year.
The cost of living in Lansing, MI is 8.2% lower than the national average. Generally, housing in Lansing is 17.2% less expensive than the national average, with rent falling between $918 - $1,568. You can expect to pay 10.1% less for groceries, 3.9% more for utilities, and 10.9% more for transportation.
Compare Cities
Explore how walkable, bikeable, drivable, and transit-friendly Lansing, MI is for everyday living.
Fairly Walkable
Walkability
Limited Public Transit
Transit
Exceptionally Drivable
Drivability
Very Bikeable
Bikeability
Delta Center Elementary School
Public
Grades K-5
501 Students

Public
Grades PK-8
522 Students

Windemere Park Charter Academy
Public
Grades K-8
568 Students

Public
Grades K-8
513 Students
Public
Grades K-5
350 Students
Public
Grades PK-8
522 Students
Public
Grades 6-12
986 Students
Windemere Park Charter Academy
Public
Grades K-8
568 Students
Public
Grades K-8
513 Students
Public
Grades 6-12
924 Students

Public
Grades 6-12
986 Students
Public
Grades 9-12
975 Students
Public
Grades 6-12
924 Students
Public
Grades 6-12
528 Students

Public
Grades 9-12
817 Students

† Our analysis of utilities, groceries, transportation, healthcare, home prices, and other goods and services is sourced from the Cost of Living Index, a respected benchmark published by the Council for Community and Economic Research (C2ER) that provides a thorough overview of living expenses across different regions.
Rent data is provided by CoStar Group’s Market Trend reports. As the industry leader in commercial real estate information, analytics, and news, CoStar conducts extensive research to produce and maintain a comprehensive database of commercial real estate information. We combine this data with public record to provide the most up-to-date rental information available.
Consumer goods, services, and home prices are sourced from the Cost of Living Index published by the Council for Community and Economic Research (C2ER). The data on this page is updated quarterly. It was last published in June 2026.
Demographic information comes from Neustar and combines detailed address data with U.S. Census and American Community Survey statistics to produce reliable local estimates.


