Median Age
35 Years
Largest Age Group
25-34 Years
Approximately 17% of Residents
Under 20
26%
Over 65
14%
Avg Rent
$1,548
Population
59,005
Renter Mix
58% Rent
Welcome to Lancaster, Pennsylvania, where historic charm meets contemporary living. Downtown Lancaster features preserved 18th and 19th-century architecture along its streets, creating an engaging atmosphere for residents. The housing market includes various options, from historic row homes in the downtown area to newer communities in School Lane Hills and the Northwest Corridor. Recent data shows average monthly rents ranging from $1,144 for studios to $1,956 for three-bedroom units, with most rental options seeing modest increases of 3-4% over the past year. The city's cultural district, particularly Gallery Row, showcases over 40 art galleries and studios, while the historic Central Market, America's oldest continuously operating farmers' market, offers fresh local produce and regional specialties.
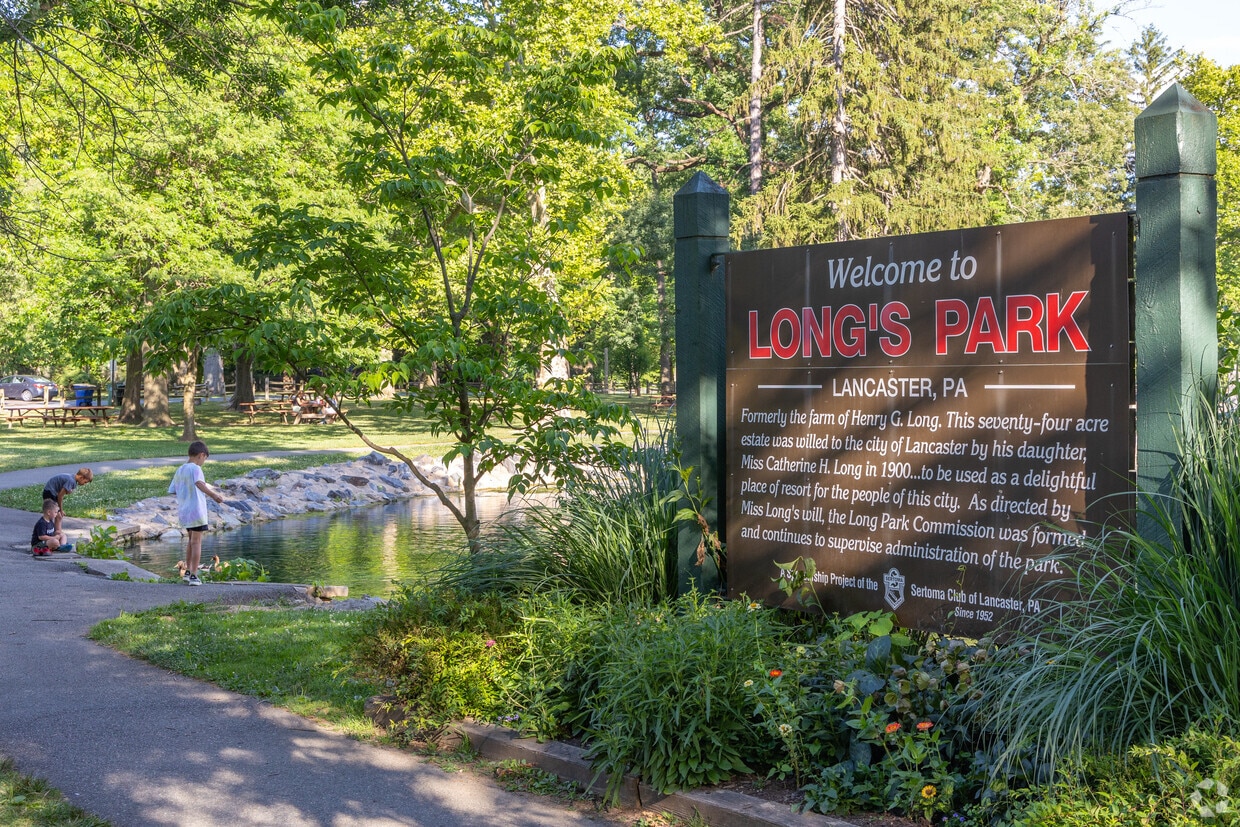
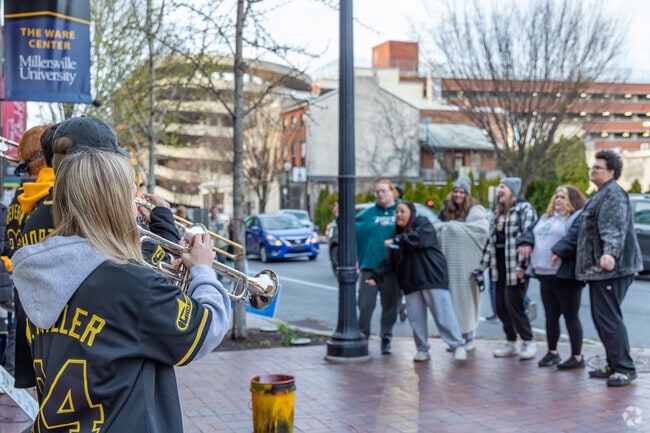
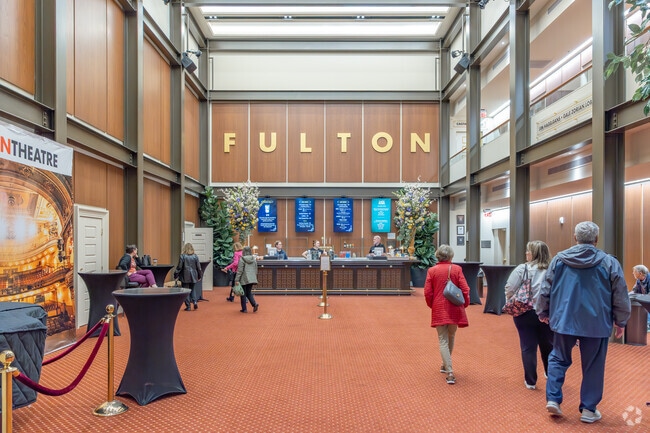
Lancaster combines small-city appeal with city conveniences. Franklin & Marshall College contributes to the western part of the city's character, while the Fulton Opera House, a National Historic Landmark, serves as a cornerstone of local entertainment. Long's Park provides outdoor recreation space and hosts summer concerts and festivals. The city has grown into a multicultural community over the years, enriching its neighborhoods with diverse perspectives and traditions. Notable areas include the East Side, recognized for its tree-lined streets and Victorian architecture, and the Chestnut Hill area. Downtown Lancaster features an array of local shops, dining options, and cultural venues, making it an appealing place to call home.
East Side residents can watch plays at Fulton Theatre, the oldest working theatre in the US.
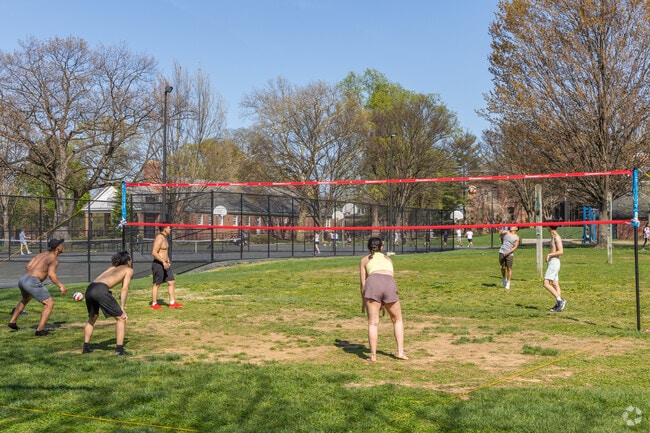
Nice days in Chestnut Hills see an array of activities in Buchanan Park, like volleyball games.
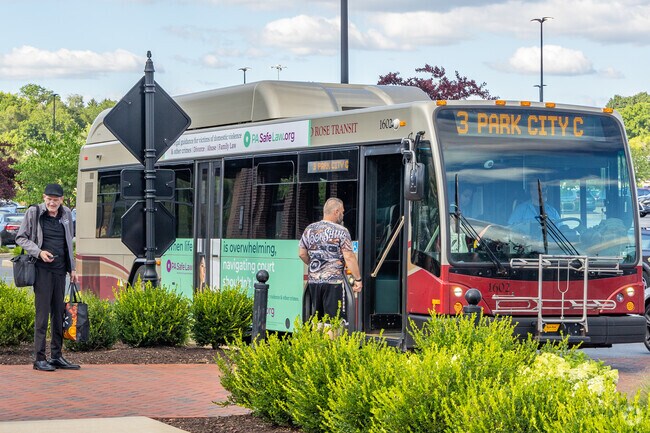
Many bus routes run through Rohrerstown, getting commuters around the greater Lancaster area.
The Conestoga Creek flows through Lancaster County Central Park.
Farmdale has a number of roadside farm markets with a variety of freshly grown produce.
Median Household Income
$55,857
Average: $72,139
Education
14,105
Residents Have a Degree
Job Market
30,224
Workers Employed
Median Age
35 Years
Largest Age Group
25-34 Years
Approximately 17% of Residents
Under 20
26%
Over 65
14%
Housing Distribution
Lancaster has more renters than homeowners.

Education Distribution
Review this city's overall education levels.

As of July 2026, the average apartment rent in Lancaster, PA is $1,342 for a studio, $1,547 for one bedroom, $1,801 for two bedrooms, and $2,140 for three bedrooms. Apartment rent in Lancaster has increased by 2.3% in the past year.
Explore how walkable, bikeable, drivable, and transit-friendly Lancaster, PA is for everyday living.
Moderately Walkable
Walkability
Some Public Transit
Transit
Very Drivable
Drivability
Somewhat Bikeable
Bikeability
Public
Grades K-5
466 Students

Landis Run Intermediate School
Public
Grades K-5
929 Students

Public
Grades K-5
403 Students
Public
Grades K-5
283 Students
Public
Grades K-5
574 Students

Public
Grades 6-8
472 Students
Public
Grades 6-8
559 Students
Public
Grades 6-8
914 Students

Gerald G Huesken Middle School
Public
Grades 6-8
965 Students

Public
Grades 6-8
511 Students

Public
Grades 9-12
1,953 Students
Conestoga Valley Senior High School
Public
Grades 9-12
1,282 Students
Public
Grades 9-12
2,600 Students
La Academia-The Partnership Charter School
Public
Grades 6-12
196 Students

Public
Grades 6-12
305 Students

† Our analysis of utilities, groceries, transportation, healthcare, home prices, and other goods and services is sourced from the Cost of Living Index, a respected benchmark published by the Council for Community and Economic Research (C2ER) that provides a thorough overview of living expenses across different regions.
Rent data is provided by CoStar Group’s Market Trend reports. As the industry leader in commercial real estate information, analytics, and news, CoStar conducts extensive research to produce and maintain a comprehensive database of commercial real estate information. We combine this data with public record to provide the most up-to-date rental information available.
Consumer goods, services, and home prices are sourced from the Cost of Living Index published by the Council for Community and Economic Research (C2ER). The data on this page is updated quarterly. It was last published in June 2026.
Demographic information comes from Neustar and combines detailed address data with U.S. Census and American Community Survey statistics to produce reliable local estimates.


