Median Age
41 Years
Largest Age Group
60-69 Years
Approximately 13% of Residents
Under 20
26%
Over 65
22%


Avg Rent
$753
Population
21,359
Renter Mix
54% Rent
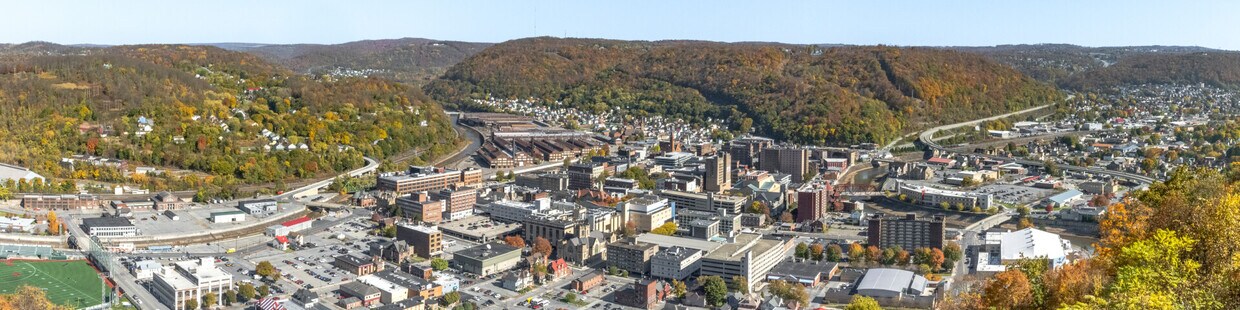
Nestled among the hills and valleys of southwest Pennsylvania, Johnstown is a small and fairly secluded city that wears its rich history on its sleeve. In addition to the numerous monuments and museums around town, many historic structures like the antique buildings downtown and the Silver Drive-In Theater are well-preserved and still in regular use. The Downtown district displays a timeless sense of classic Americana, featuring a walkable collective of unique shops and restaurants clustered around Central Park. Point Stadium serves as a popular hangout for locals during baseball season, and the Flood City Music Festival attracts big crowds and national headliners to town every summer.
The surrounding natural landscape offers endless opportunities for exploration with miles of trails traversing the regions rugged and scenic countryside.
Walnut Grove residents can enjoy convenient, city amenities provided by the downtown area.
Central Park is a park located in the center of Johnstown PA.
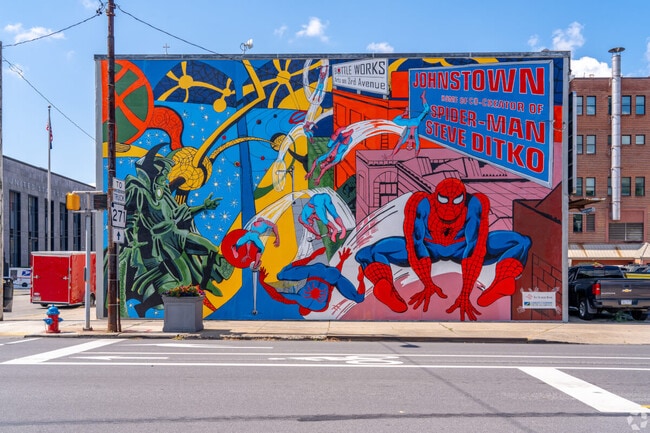
Johnstown is hometown to one of the creators of Spiderman, the late Steve Ditko.
Median Household Income
$33,021
Average: $43,387
Education
2,809
Residents Have a Degree
Job Market
8,066
Workers Employed
Median Age
41 Years
Largest Age Group
60-69 Years
Approximately 13% of Residents
Under 20
26%
Over 65
22%
Housing Distribution
Johnstown has more renters than homeowners.

Education Distribution
Review this city's overall education levels.

As of July 2026, the average apartment rent in Johnstown, PA is $753 for one bedroom, $928 for two bedrooms, and $1,014 for three bedrooms. Apartment rent in Johnstown has increased by 3.8% in the past year.
The cost of living in Johnstown, PA is 6.8% lower than the national average. Generally, housing in Johnstown is 29.3% less expensive than the national average, with rent falling between $0 - $1,014. You can expect to pay 6.2% more for groceries, 6.5% more for utilities, and 10.4% more for transportation.
Compare Cities
Explore how walkable, bikeable, drivable, and transit-friendly Johnstown, PA is for everyday living.
Moderately Walkable
Walkability
Exceptionally Drivable
Drivability
Somewhat Bikeable
Bikeability
Public
Grades K-5
749 Students

Public
Grades K-5
831 Students

Public
Grades PK-5
392 Students

Public
Grades K-5
389 Students
Public
Grades K-5
208 Students
Public
Grades 6-12
693 Students
Westmont Hilltop Middle School
Public
Grades 5-8
484 Students
Public
Grades 6-12
725 Students

Conemaugh Valley Junior-Senior High School
Public
Grades 6-12
308 Students
Greater Johnstown Middle School
Public
Grades K-8
615 Students

Public
Grades 6-12
693 Students
Public
Grades 9-12
471 Students
Public
Grades 6-12
725 Students
Conemaugh Valley Junior-Senior High School
Public
Grades 6-12
308 Students
Ferndale Area Junior-Senior High School
Public
Grades 6-12
284 Students
† Our analysis of utilities, groceries, transportation, healthcare, home prices, and other goods and services is sourced from the Cost of Living Index, a respected benchmark published by the Council for Community and Economic Research (C2ER) that provides a thorough overview of living expenses across different regions.
Rent data is provided by CoStar Group’s Market Trend reports. As the industry leader in commercial real estate information, analytics, and news, CoStar conducts extensive research to produce and maintain a comprehensive database of commercial real estate information. We combine this data with public record to provide the most up-to-date rental information available.
Consumer goods, services, and home prices are sourced from the Cost of Living Index published by the Council for Community and Economic Research (C2ER). The data on this page is updated quarterly. It was last published in June 2026.
Demographic information comes from Neustar and combines detailed address data with U.S. Census and American Community Survey statistics to produce reliable local estimates.


