Median Age
56 Years
Largest Age Group
60-69 Years
Approximately 18% of Residents
Under 20
16%
Over 65
35%
Avg Rent
$1,671
Population
12,821
Renter Mix
25% Rent
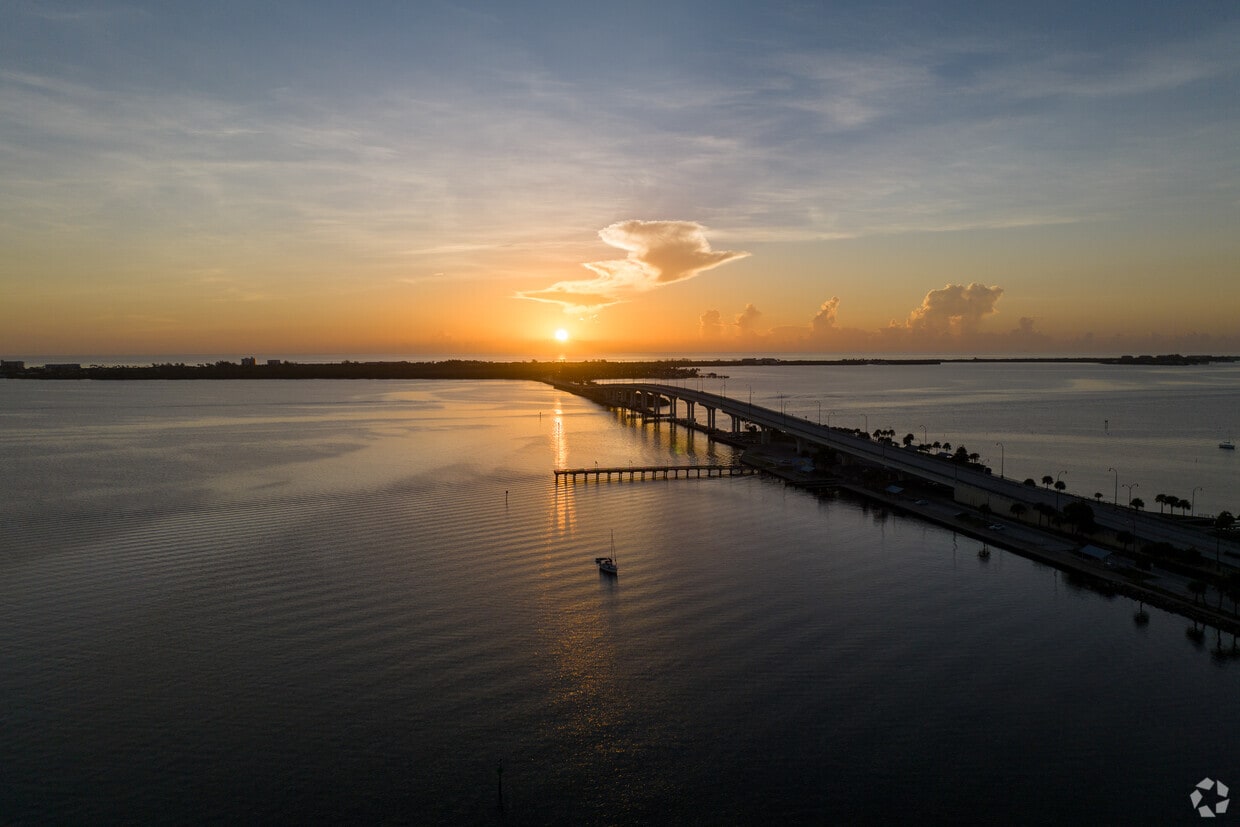
Jensen Beach is an unincorporated community on Florida's Treasure Coast, occupying a narrow strip of land between the Indian River Lagoon and the Atlantic Ocean in Martin County. The area draws renters who want coastal access without the congestion of larger South Florida metros, and the pace here is noticeably slower and more grounded than in neighboring Palm Beach County to the south. Martin County's economy leans on healthcare, marine industries, and local government, with Cleveland Clinic Martin Health serving as one of the area's largest employers. Indian River State College, just a short drive away in Fort Pierce, extends higher-education options to residents throughout the region. Jensen Beach's housing stock reflects its small-town coastal character: renters will find a mix of low-rise apartment communities, garden-style buildings, and townhomes, many within a short distance of the water. Neighborhoods range from quiet residential pockets near the lagoon to areas closer to US-1 with more commercial activity nearby. One distinctive point of local pride is Jensen Beach's long history as a pineapple-growing hub, earning it the historic nickname "The Pineapple Capital of the World." That agricultural heritage still surfaces in community events and local identity today.
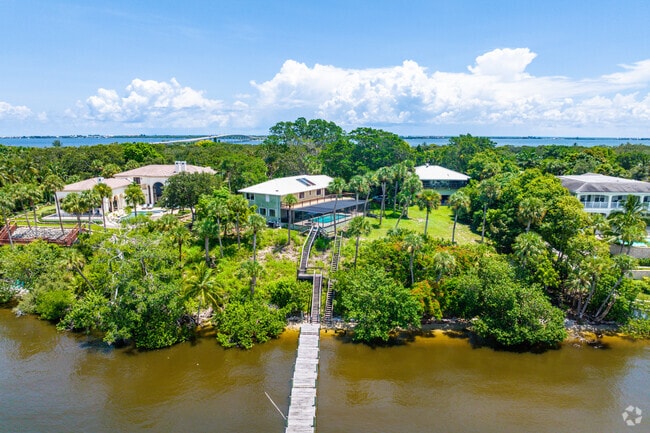
Many of the waterfront homes in Sewall's Pointe have mangroves protecting their shores.
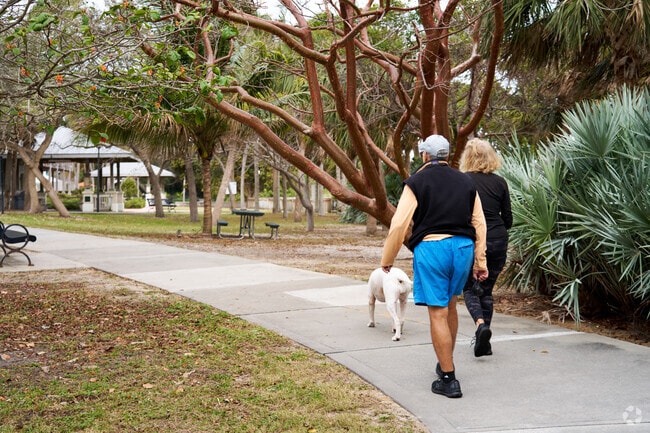
Enjoy a stroll in the large green spaces of Indian Riverside park in Jensen Beach.
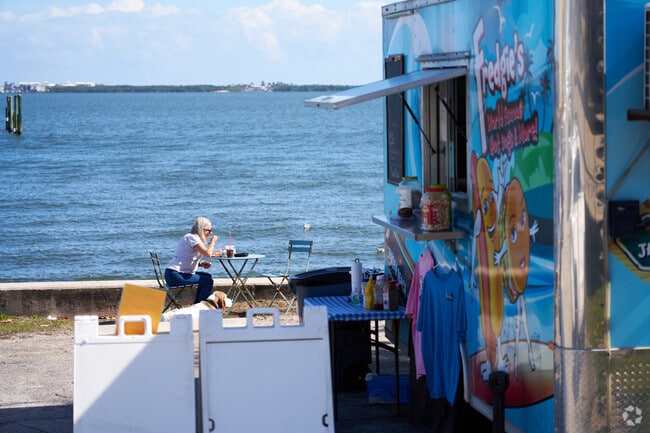
Fredgies is a popular spot to have a hotdog right on the water in Jensen Beach.
Get a bite outdoors at Mulligan's in Downtown Jensen Beach.
C. Barbours Produce in Jensen Beach is the place to go for fresh local produce.
Catch the Marty bus on US1 to get to the Area Regional Transit in Jensen Beach.
Median Household Income
$50,085
Average: $77,725
Education
4,116
Residents Have a Degree
Job Market
5,350
Workers Employed
Median Age
56 Years
Largest Age Group
60-69 Years
Approximately 18% of Residents
Under 20
16%
Over 65
35%
Housing Distribution
Jensen Beach has more homeowners than renters.

Education Distribution
Review this city's overall education levels.

As of July 2026, the average apartment rent in Jensen Beach, FL is $654 for a studio, $1,644 for one bedroom, $2,093 for two bedrooms, and $2,329 for three bedrooms. Apartment rent in Jensen Beach has decreased by -0.5% in the past year.
Explore how walkable, bikeable, drivable, and transit-friendly Jensen Beach, FL is for everyday living.
Fairly Walkable
Walkability
Very Drivable
Drivability
Fairly Bikeable
Bikeability
Jensen Beach Elementary School
Public
Grades PK-5
610 Students

Public
Grades 9-12
1,705 Students

† Our analysis of utilities, groceries, transportation, healthcare, home prices, and other goods and services is sourced from the Cost of Living Index, a respected benchmark published by the Council for Community and Economic Research (C2ER) that provides a thorough overview of living expenses across different regions.
Rent data is provided by CoStar Group’s Market Trend reports. As the industry leader in commercial real estate information, analytics, and news, CoStar conducts extensive research to produce and maintain a comprehensive database of commercial real estate information. We combine this data with public record to provide the most up-to-date rental information available.
Consumer goods, services, and home prices are sourced from the Cost of Living Index published by the Council for Community and Economic Research (C2ER). The data on this page is updated quarterly. It was last published in June 2026.
Demographic information comes from Neustar and combines detailed address data with U.S. Census and American Community Survey statistics to produce reliable local estimates.


