
Median Age
41 Years
Largest Age Group
30-39 Years
Approximately 13% of Residents
Under 20
24%
Over 65
21%


Avg Rent
$1,033
Population
117,321
Renter Mix
40% Rent
As the launchpad for much of America’s westward migration in the 19th century, the culture of Independence is deeply rooted in its history. Museums, landmarks, and historical markers are everywhere, making it an ideal rental location for folks with scholarly interests.
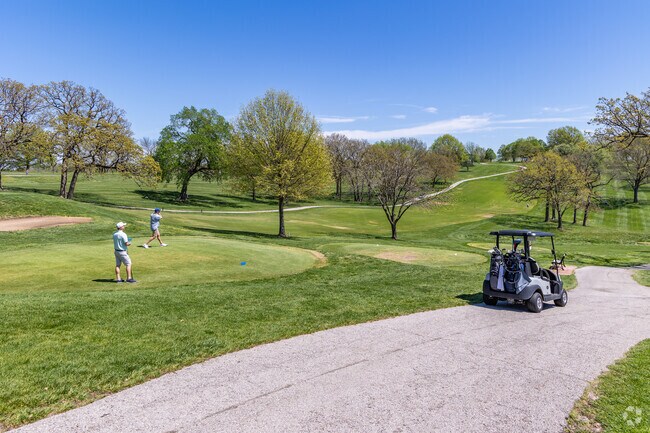
Nothing in Kansas City is more than 30 minutes away, and sports fans will appreciate the fact that Arrowhead Stadium and Kauffman Stadium are practically right next door on the southwest corner of Independence. To the east, residents have convenient access to loads of outdoor recreation, including several golf courses and the spacious Fleming Park.
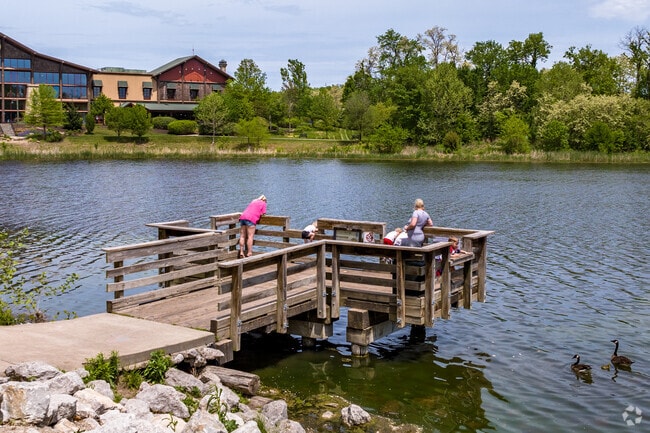
Waterfall Park pier for fishing.
Residents of Kentucky Hills enjoy a variety of green space.
If you love golf, play the 18-hole public course at Swope Park in Kansas City, MO.
If you are looking for home-style cooking that you don't have to make, try Englewood Cafe.
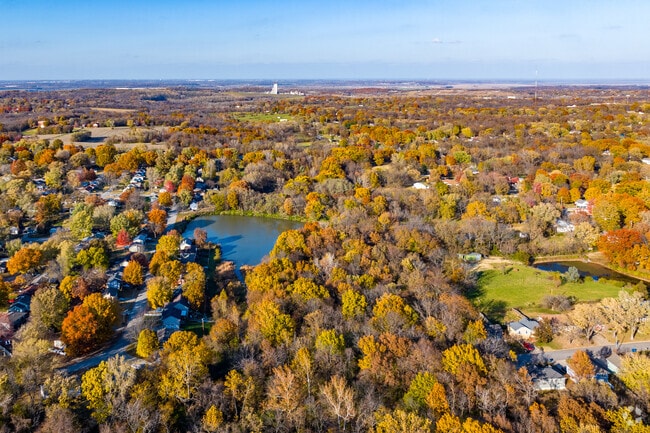
Trails weave through Independence as locals use Bund-Jack Park and Little Blue Trace Trail.
Wild About Harry is a gift shop in downtown Independence and it's all the rave.
Median Household Income
$58,906
Average: $74,191
Education
21,552
Residents Have a Degree
Job Market
56,435
Workers Employed
Median Age
41 Years
Largest Age Group
30-39 Years
Approximately 13% of Residents
Under 20
24%
Over 65
21%
Housing Distribution
Independence has more homeowners than renters.

Education Distribution
Review this city's overall education levels.

As of July 2026, the average apartment rent in Independence, MO is $704 for a studio, $1,030 for one bedroom, $1,277 for two bedrooms, and $1,682 for three bedrooms. Apartment rent in Independence has increased by 3.1% in the past year.
Explore how walkable, bikeable, drivable, and transit-friendly Independence, MO is for everyday living.
Somewhat Walkable
Walkability
Minimal Public Transit
Transit
Exceptionally Drivable
Drivability
Fairly Bikeable
Bikeability
William Yates Elementary School
Public
Grades K-5
463 Students

Public
Grades K-5
414 Students
Public
Grades PK-5
386 Students

Santa Fe Trail Elementary School
Public
Grades PK-5
386 Students
Public
Grades PK-5
290 Students
Public
Grades K-8
770 Students

Public
Grades K-8
744 Students
Clifford H. Nowlin Middle School
Public
Grades 6-8
902 Students

Public
Grades 6-8
875 Students
Public
Grades 6-8
806 Students

Public
Grades 9-12
1,662 Students
Public
Grades 9-12
1,662 Students
Public
Grades 9-12
1,557 Students

Public
Grades 9-12
1,557 Students
Public
Grades 9-12
1,406 Students
† Our analysis of utilities, groceries, transportation, healthcare, home prices, and other goods and services is sourced from the Cost of Living Index, a respected benchmark published by the Council for Community and Economic Research (C2ER) that provides a thorough overview of living expenses across different regions.
Rent data is provided by CoStar Group’s Market Trend reports. As the industry leader in commercial real estate information, analytics, and news, CoStar conducts extensive research to produce and maintain a comprehensive database of commercial real estate information. We combine this data with public record to provide the most up-to-date rental information available.
Consumer goods, services, and home prices are sourced from the Cost of Living Index published by the Council for Community and Economic Research (C2ER). The data on this page is updated quarterly. It was last published in June 2026.
Demographic information comes from Neustar and combines detailed address data with U.S. Census and American Community Survey statistics to produce reliable local estimates.


