Median Age
41 Years
Largest Age Group
60-69 Years
Approximately 14% of Residents
Under 20
23%
Over 65
22%
Avg Rent
$931
Population
10,857
Renter Mix
61% Rent
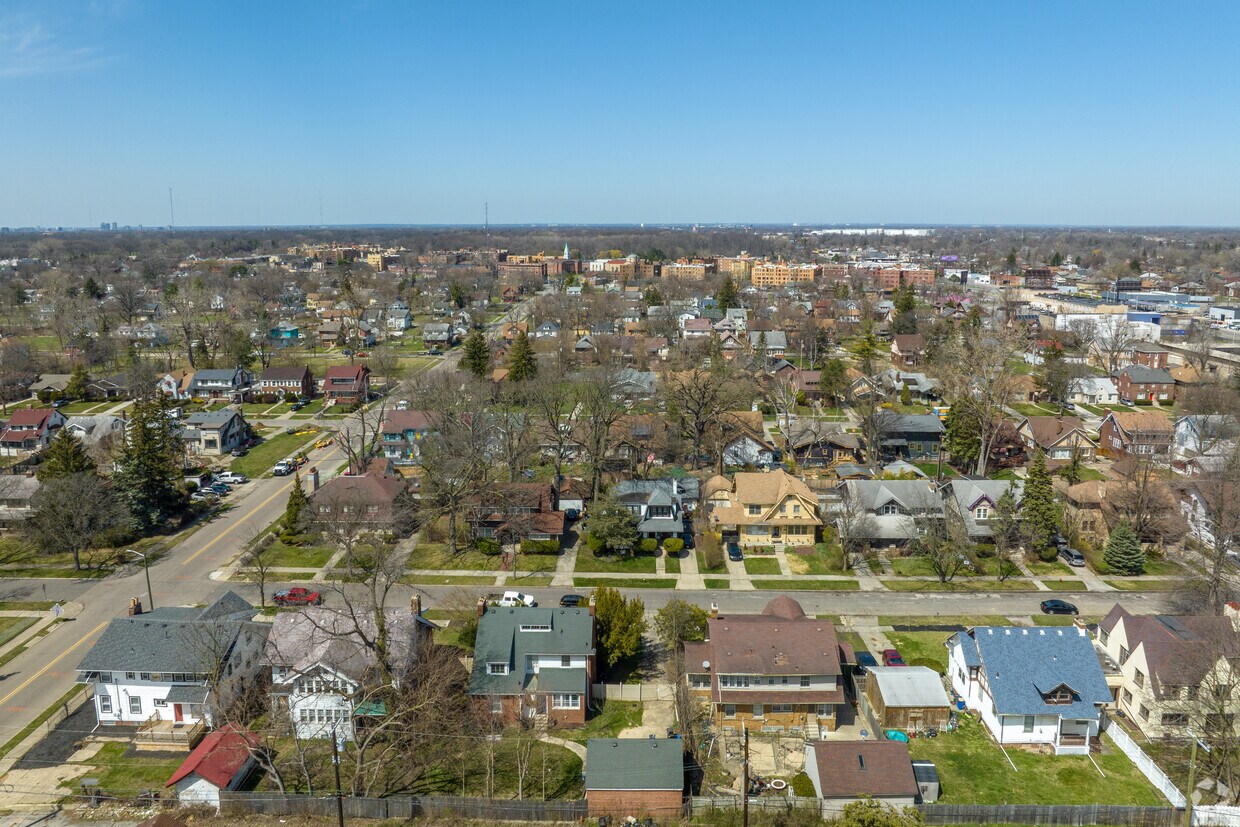
Highland Park, Michigan carries a distinct identity as an enclave city entirely surrounded by Detroit, sitting just a few miles north of the downtown core. Though it spans only three square miles, its history runs deep — Henry Ford opened his legendary Model T assembly plant here in 1910, making Highland Park a cornerstone of American industrial history.
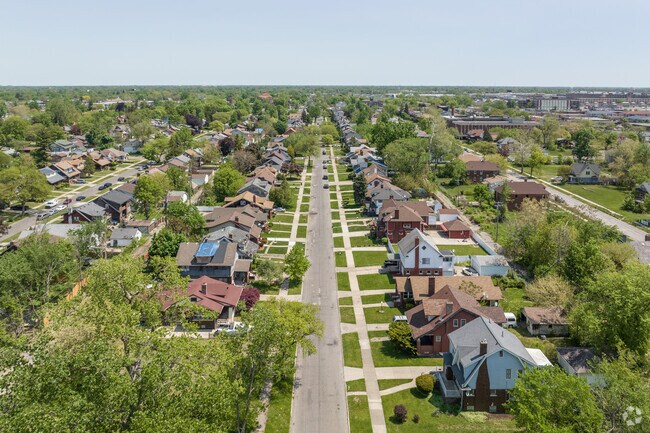
Today, the city blends closely knit residential neighborhoods with easy access to Detroit's broader cultural and economic energy. Its proximity to the University of Detroit Mercy and Marygrove College gives the area an educational anchor that shapes the local atmosphere. Streets are lined with traditional brick homes, bungalows, and well-established apartment communities that reflect the architectural character of early 20th-century Michigan.
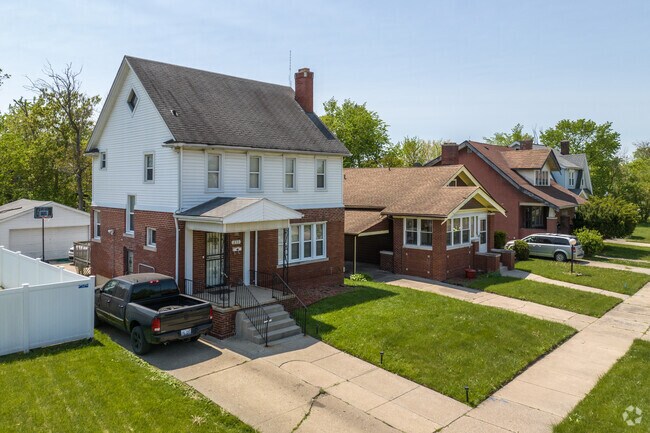
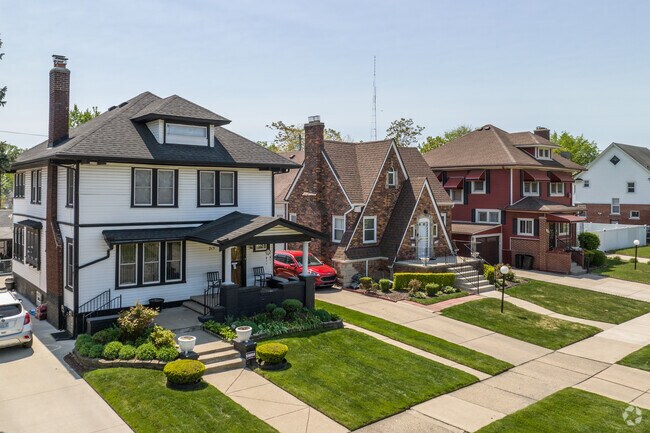
Traditional and Cottage Homes in Highland Park.
American Four-Squares and brick Tudors are great places to raise a family in Highland Park.
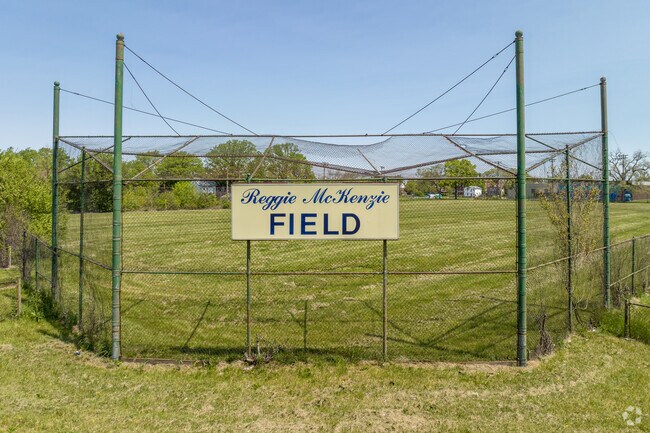
McKenzie Baseball Field in Highland Park.
Highland Park residents enjoy a pickup game of basketball.
The 4 Woodward bus line runs through Highland Park.
Highland Park residents enjoy brunch at Joe Louis Southern Kitchen down Woodward Ave.
Median Household Income
$29,542
Average: $50,994
Education
1,499
Residents Have a Degree
Job Market
3,925
Workers Employed
Median Age
41 Years
Largest Age Group
60-69 Years
Approximately 14% of Residents
Under 20
23%
Over 65
22%
Housing Distribution
Highland Park has more renters than homeowners.

Education Distribution
Review this city's overall education levels.

As of July 2026, the average apartment rent in Highland Park, MI is $704 for a studio, $931 for one bedroom, $1,078 for two bedrooms, and $1,196 for three bedrooms. Apartment rent in Highland Park has increased by 1.1% in the past year.
Explore how walkable, bikeable, drivable, and transit-friendly Highland Park, MI is for everyday living.
Moderately Walkable
Walkability
Limited Public Transit
Transit
Exceptionally Drivable
Drivability
Fairly Bikeable
Bikeability
Public
Grades PK-8
356 Students

George Washington Carver Elementary School
Public
Grades PK-5
213 Students
Sigma Academy for Leadership and Early Middle College
Public
Grades K-12
93 Students

Public
Grades PK-8
356 Students
Public
Grades 6-12
102 Students

Sigma Academy for Leadership and Early Middle College
Public
Grades K-12
93 Students
Public
Grades 6-12
102 Students
Creative Learning Center Highland Park
Public
Grades 9-12
179 Students
Sigma Academy for Leadership and Early Middle College
Public
Grades K-12
93 Students
† Our analysis of utilities, groceries, transportation, healthcare, home prices, and other goods and services is sourced from the Cost of Living Index, a respected benchmark published by the Council for Community and Economic Research (C2ER) that provides a thorough overview of living expenses across different regions.
Rent data is provided by CoStar Group’s Market Trend reports. As the industry leader in commercial real estate information, analytics, and news, CoStar conducts extensive research to produce and maintain a comprehensive database of commercial real estate information. We combine this data with public record to provide the most up-to-date rental information available.
Consumer goods, services, and home prices are sourced from the Cost of Living Index published by the Council for Community and Economic Research (C2ER). The data on this page is updated quarterly. It was last published in June 2026.
Demographic information comes from Neustar and combines detailed address data with U.S. Census and American Community Survey statistics to produce reliable local estimates.


