Median Age
38 Years
Largest Age Group
0-9 Years
Approximately 14% of Residents
Under 20
26%
Over 65
17%

Area Guide
Avg Rent
$2,778
Population
37,901
Renter Mix
40% Rent
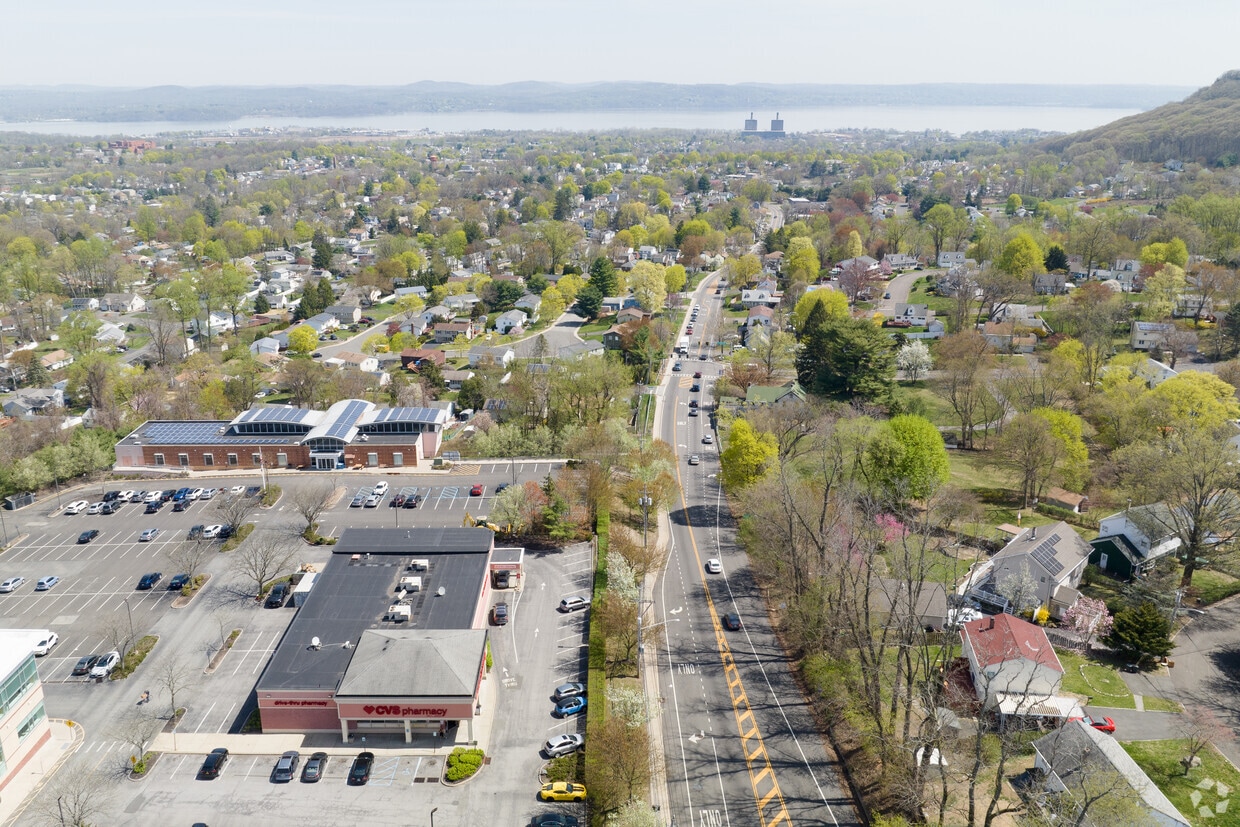
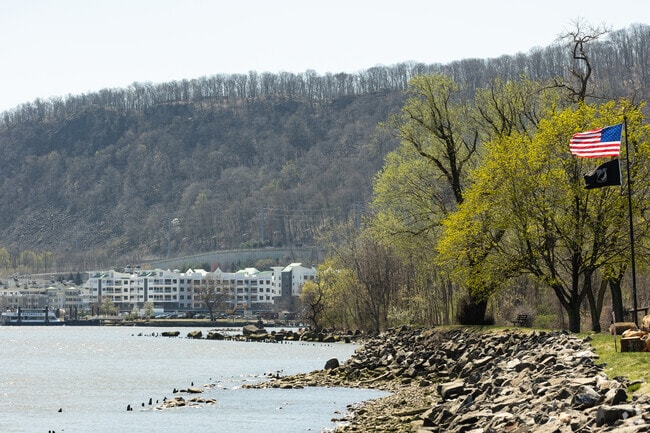
Haverstraw sits on the western banks of the Hudson River in Rockland County, a town whose name traces back to the Dutch word for "oats straw" and whose history stretches to Henry Hudson's exploration of the region in 1609. Today, the town is home to nearly 39,000 residents spread across 28 square miles, and it has grown into a destination with a strong sense of community, from its historic downtown on Main Street to the Haverstraw Brick Museum, which tells the story of how local bricks helped build much of New York City. Those searching for apartments for rent in Haverstraw will find a community that balances a relaxed, small-town feel with easy access to the greater New York metro area.
Renters in Haverstraw can choose from a range of housing options, including apartment communities, condos, townhomes, and houses spread throughout the town and its villages. The historic village of Haverstraw serves as the town's densest and most walkable area, with colorful shops and dining along Main Street. Outdoor enthusiasts will appreciate the proximity to Bowline Point Park along the riverfront, as well as High Tor State Park and the expansive Harriman State Park. Bear Mountain State Park is also within a short drive. Nearby Pacesetter Park Shopping Center and Rosman Center provide everyday conveniences close to home.
Getting around from Haverstraw is straightforward. A ferry service connects residents to the Metro-North train network, making Manhattan accessible without a car. For those who drive, major roadways offer direct routes into New York City and surrounding Rockland County communities. Westchester County Airport is about 31 miles away, and New York Stewart International Airport is a similar distance to the north. SUNY Rockland is within 7 miles, and Ramapo College of New Jersey and Nyack College are both reachable in under 25 minutes. With Hudson River views, a walkable downtown, and solid transit connections, Haverstraw offers renters a genuine sense of community within reach of one of the world's great cities.
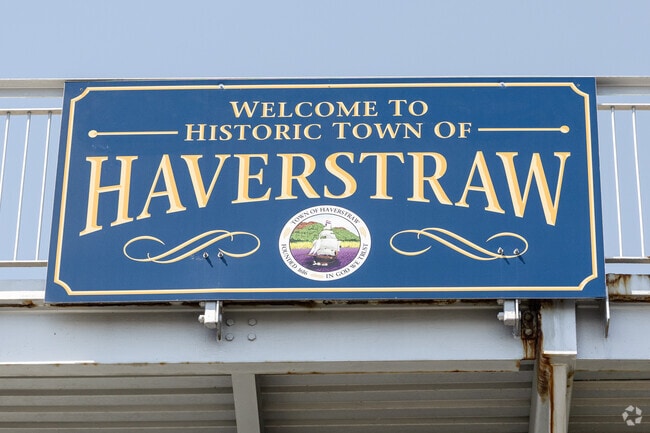
Welcome to historic Haverstraw, a charming community on the Hudson in New York.
Come and enjoy Sector Park in Pomona where you can fish, walk, hike or just relax.
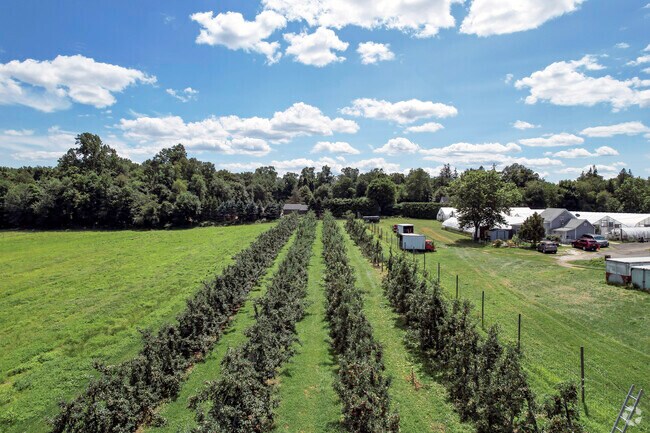
The Orchards of Concklin has put its stamp on the Pomona region.
Clover Stadium in Pomona is the home field of the New York Boulders of the Frontier League.
In Pomona immaculate homes of differing shapes and sizes make up the community.
The North Rockland High school is the largest educational institution in Stony Point, NY.
Median Household Income
$88,256
Average: $107,876
Education
10,124
Residents Have a Degree
Job Market
19,224
Workers Employed
Median Age
38 Years
Largest Age Group
0-9 Years
Approximately 14% of Residents
Under 20
26%
Over 65
17%
Housing Distribution
Haverstraw has more homeowners than renters.

Education Distribution
Review this city's overall education levels.

As of June 2026, the average apartment rent in Haverstraw, NY is $2,152 for a studio, $2,761 for one bedroom, $4,070 for two bedrooms, and $4,462 for three bedrooms. Apartment rent in Haverstraw has increased by 2.8% in the past year.
Explore how walkable, bikeable, drivable, and transit-friendly Haverstraw, NY is for everyday living.
Somewhat Walkable
Walkability
Exceptionally Drivable
Drivability
Somewhat Bikeable
Bikeability
Public
Grades K-5
661 Students

Gerald F Neary Elementary School
Public
Grades K-5
121 Students

† Our analysis of utilities, groceries, transportation, healthcare, home prices, and other goods and services is sourced from the Cost of Living Index, a respected benchmark published by the Council for Community and Economic Research (C2ER) that provides a thorough overview of living expenses across different regions.
Rent data is provided by CoStar Group’s Market Trend reports. As the industry leader in commercial real estate information, analytics, and news, CoStar conducts extensive research to produce and maintain a comprehensive database of commercial real estate information. We combine this data with public record to provide the most up-to-date rental information available.
Consumer goods, services, and home prices are sourced from the Cost of Living Index published by the Council for Community and Economic Research (C2ER). The data on this page is updated quarterly. It was last published in June 2026.
Demographic information comes from Neustar and combines detailed address data with U.S. Census and American Community Survey statistics to produce reliable local estimates.


