Median Age
42 Years
Largest Age Group
30-39 Years
Approximately 16% of Residents
Under 20
20%
Over 65
19%


Avg Rent
$2,231
Population
46,921
Renter Mix
67% Rent
Welcome to Hackensack, a dynamic city 12 miles northwest of Midtown Manhattan. As the Bergen County seat, this community offers diverse housing options and amenities. The rental market remains steady, with current average rents ranging from $1,886 for studios to $3,416 for three-bedroom units. One-bedroom units average $2,118, reflecting a 1.1% increase. Along Prospect Avenue, residents can find high-rise communities with Manhattan skyline views, while other neighborhoods feature garden apartments and single-family homes.
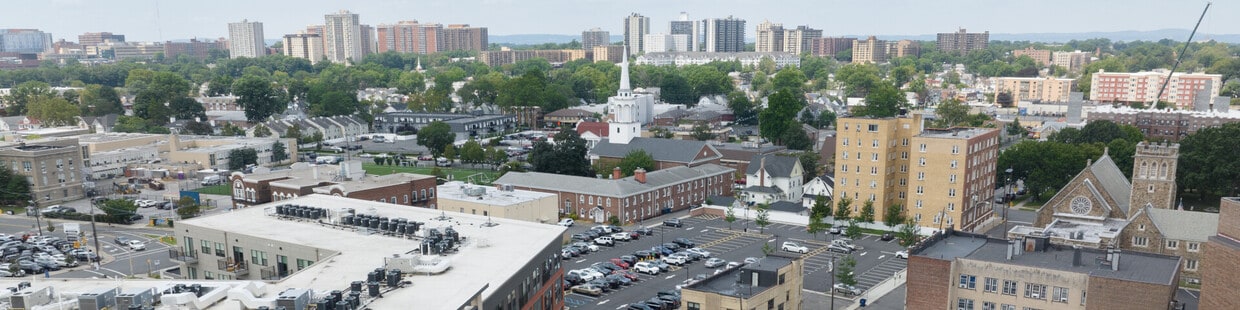
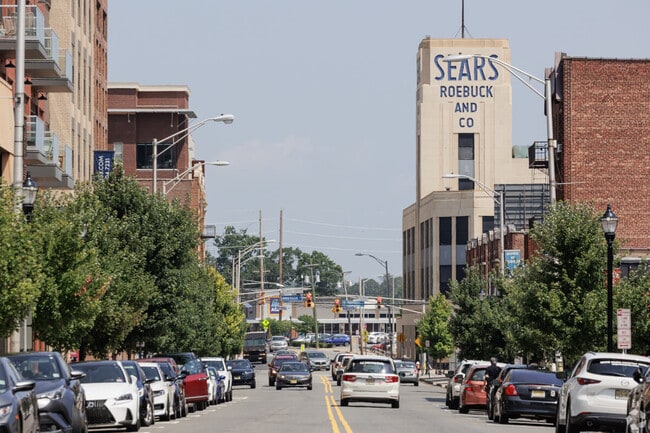
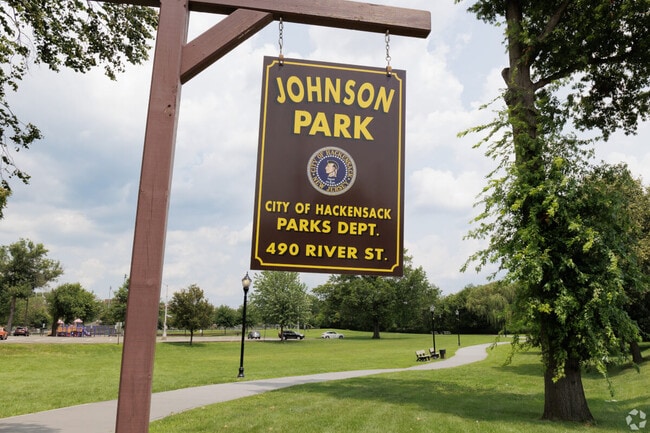
Main Street anchors Hackensack's downtown district, where historic buildings stand alongside new developments. The city houses Fairleigh Dickinson University's Metropolitan Campus along the Hackensack River and Hackensack University Medical Center. Local attractions include the Hackensack Cultural Arts Center and The Shops at Riverside mall. Outdoor spaces like Hackensack River County Park and Borg's Woods Nature Preserve provide recreational opportunities, while landmarks such as the First Dutch Reformed Church, established in 1696, showcase the area's heritage. With multiple train stations and bus routes serving the community, Hackensack offers convenient access to New York City and surrounding areas.
Downtown Hackensack is a busting place.
Johnson Park offers a retreat to escape the city.
There are plenty of fun events in Hackensack to enjoy.
Median Household Income
$73,838
Average: $92,823
Education
16,138
Residents Have a Degree
Job Market
26,122
Workers Employed
Median Age
42 Years
Largest Age Group
30-39 Years
Approximately 16% of Residents
Under 20
20%
Over 65
19%
Housing Distribution
Hackensack has more renters than homeowners.

Education Distribution
Review this city's overall education levels.

As of July 2026, the average apartment rent in Hackensack, NJ is $1,903 for a studio, $2,239 for one bedroom, $3,097 for two bedrooms, and $3,605 for three bedrooms. Apartment rent in Hackensack has increased by 3.2% in the past year.
The cost of living in Hackensack, NJ is 22.2% higher than the national average. Generally, housing in Hackensack is 61.0% more expensive than the national average, with rent falling between $1,903 - $3,605. You can expect to pay 7.1% more for groceries, 5.3% more for utilities, and 3.7% more for transportation.
Compare Cities
Explore how walkable, bikeable, drivable, and transit-friendly Hackensack, NJ is for everyday living.
Very Walkable
Walkability
Good Public Transit
Transit
Fairly Drivable
Drivability
Fairly Bikeable
Bikeability
Nellie K. Parker Elementary School
Public
Grades PK-5
533 Students

Public
Grades PK-5
581 Students

Fanny M. Hillers Elementary School
Public
Grades PK-5
463 Students
Jackson Avenue Elementary School
Public
Grades PK-5
426 Students
Public
Grades K-8
1,399 Students

Public
Grades K-8
1,399 Students
Public
Grades 9-12
1,116 Students

Public
Grades 9-12
1,813 Students
† Our analysis of utilities, groceries, transportation, healthcare, home prices, and other goods and services is sourced from the Cost of Living Index, a respected benchmark published by the Council for Community and Economic Research (C2ER) that provides a thorough overview of living expenses across different regions.
Rent data is provided by CoStar Group’s Market Trend reports. As the industry leader in commercial real estate information, analytics, and news, CoStar conducts extensive research to produce and maintain a comprehensive database of commercial real estate information. We combine this data with public record to provide the most up-to-date rental information available.
Consumer goods, services, and home prices are sourced from the Cost of Living Index published by the Council for Community and Economic Research (C2ER). The data on this page is updated quarterly. It was last published in June 2026.
Demographic information comes from Neustar and combines detailed address data with U.S. Census and American Community Survey statistics to produce reliable local estimates.


