Median Age
38 Years
Largest Age Group
25-34 Years
Approximately 17% of Residents
Under 20
21%
Over 65
19%
Avg Rent
$1,876
Population
39,093
Renter Mix
50% Rent
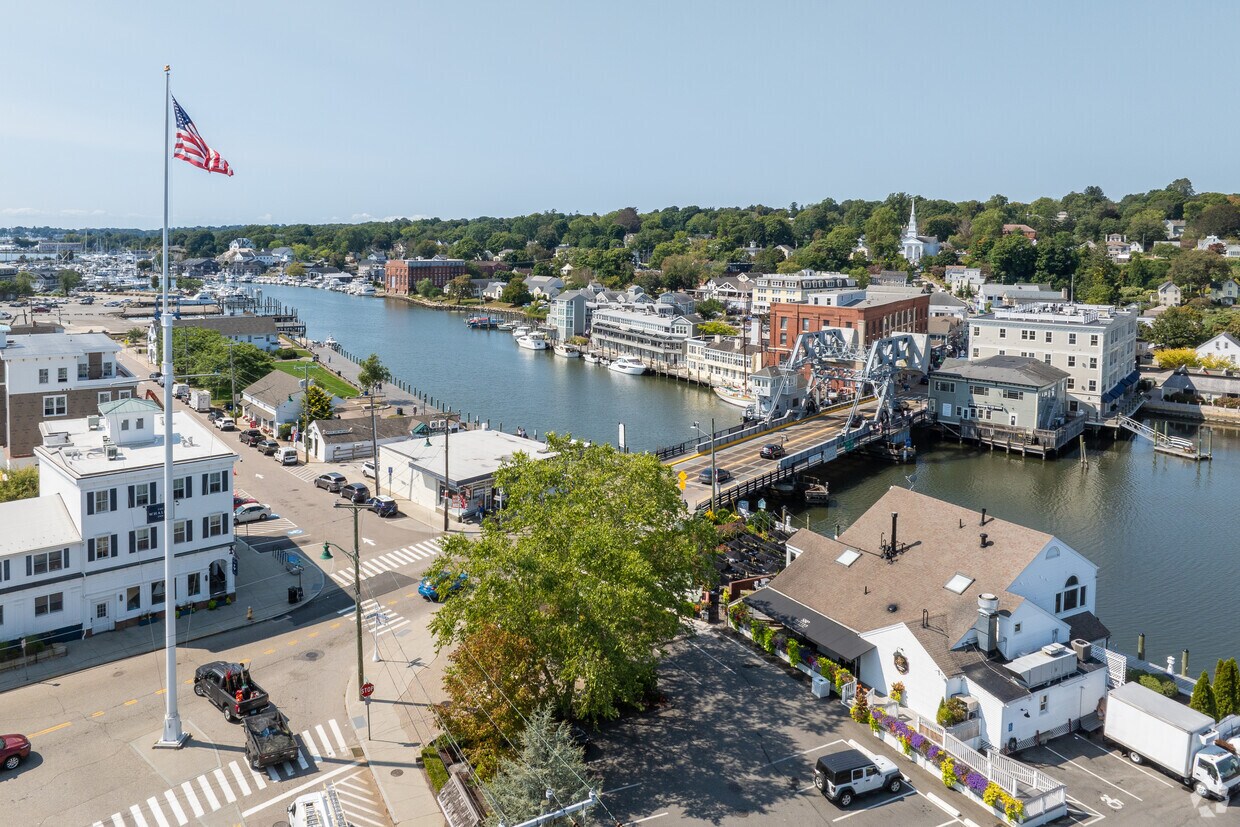
Groton, Connecticut sits on the eastern bank of the Thames River, across the water from New London, with the Long Island Sound stretching out to the south. The town has a strong identity rooted in naval history and defense industry, anchored by the Naval Submarine Base New London and General Dynamics Electric Boat, one of the country's leading submarine contractors. Pfizer also maintains a significant presence here, giving the local economy a broad, sturdy base.
Neighborhoods range from waterfront pockets near the Sound to quieter inland areas spread across Groton's roughly 46 square miles. The Avery Point campus of the University of Connecticut brings an academic energy to the southeastern corner of town, sitting right along the coast. Mystic, one of Connecticut's most recognized shoreside destinations, borders Groton to the east and adds to the area's appeal.
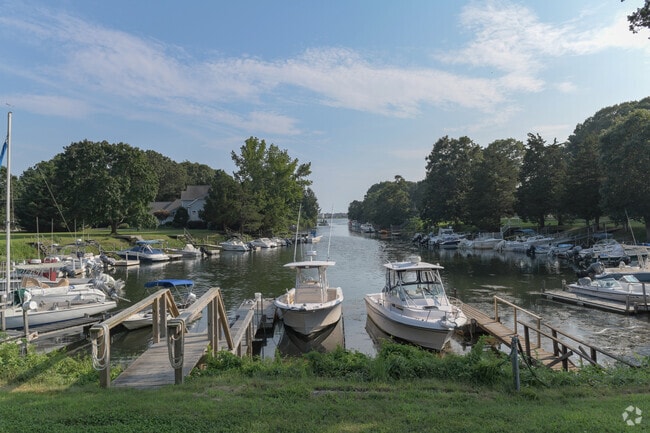
Mumford Canal is the most protected area for docks in the Mumford Cove neighborhood.
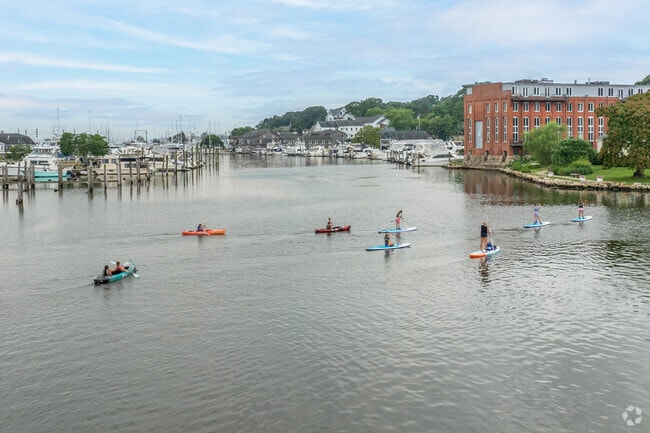
Try your hand at paddle boarding on the Mystic River in Mystic Historic District.
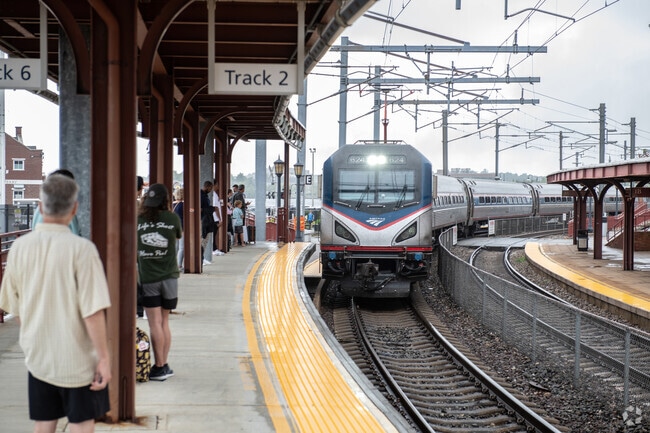
Several buses serve Groton's Long Hill neighborhood, with many stopping near Route 1.
Run through Groton and savor trucks at the Brew Run event, CT.
Waterfront properties are in no short supply in the West Mystic area.
West Mystic's drawbridge is famous but often causes significant traffic.
Median Household Income
$77,248
Average: $100,684
Education
12,891
Residents Have a Degree
Job Market
17,645
Workers Employed
Median Age
38 Years
Largest Age Group
25-34 Years
Approximately 17% of Residents
Under 20
21%
Over 65
19%
Housing Distribution
In Groton, there are roughly the same number of renters and homeowners.

Education Distribution
Review this city's overall education levels.

As of July 2026, the average apartment rent in Groton, CT is $1,787 for a studio, $1,877 for one bedroom, $2,102 for two bedrooms, and $2,660 for three bedrooms. Apartment rent in Groton has increased by 3.9% in the past year.
Explore how walkable, bikeable, drivable, and transit-friendly Groton, CT is for everyday living.
Somewhat Walkable
Walkability
Limited Public Transit
Transit
Exceptionally Drivable
Drivability
Exceptionally Bikeable
Bikeability
Catherine Kolnaski Magnet School
Public
Grades PK-5
375 Students

Public
Grades PK-5
339 Students
Public
Grades PK-5
528 Students

Public
Grades PK-5
316 Students

Public
Grades K-5
301 Students
Public
Grades 6-8
907 Students

Public
Grades 6-8
503 Students
Public
Grades 6-8
407 Students
Marine Science Magnet High School Of Southeastern Connecticut
Public
Grades 9-12
271 Students

Public
Grades 9-12
1,005 Students
Ella T. Grasso Southeastern Technical High School
Public
Grades 9-12
654 Students
Public
Grades 9-12
3 Students
† Our analysis of utilities, groceries, transportation, healthcare, home prices, and other goods and services is sourced from the Cost of Living Index, a respected benchmark published by the Council for Community and Economic Research (C2ER) that provides a thorough overview of living expenses across different regions.
Rent data is provided by CoStar Group’s Market Trend reports. As the industry leader in commercial real estate information, analytics, and news, CoStar conducts extensive research to produce and maintain a comprehensive database of commercial real estate information. We combine this data with public record to provide the most up-to-date rental information available.
Consumer goods, services, and home prices are sourced from the Cost of Living Index published by the Council for Community and Economic Research (C2ER). The data on this page is updated quarterly. It was last published in June 2026.
Demographic information comes from Neustar and combines detailed address data with U.S. Census and American Community Survey statistics to produce reliable local estimates.


