Median Age
40 Years
Largest Age Group
35-44 Years
Approximately 14% of Residents
Under 20
23%
Over 65
20%

Area Guide
Avg Rent
$1,078
Population
42,335
Renter Mix
43% Rent
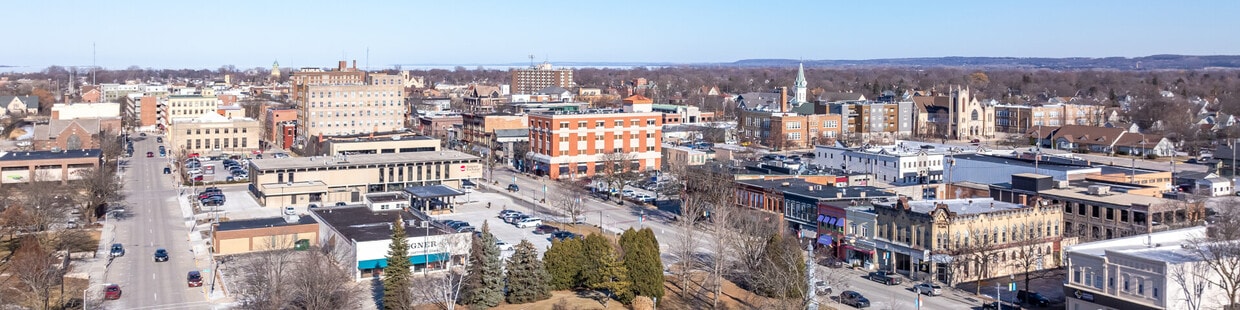
Roughly equidistant from Madison, Milwaukee, and Green Bay, Fond du Lac is a fairly small community on the southern banks of Lake Winnebago. Apartments and houses downtown and near the water are surprisingly affordable compared to its neighboring cities, making it easy to enjoy views of the lake or a more urban lifestyle without breaking the bank.
The University of Wisconsin operates a branch campus on the northeast corner of town, just a few blocks north of Marian University. The abundant open space and wildlife right outside of Fond du Lac makes the area very popular for hunting and fishing as well as hiking, biking, and camping.
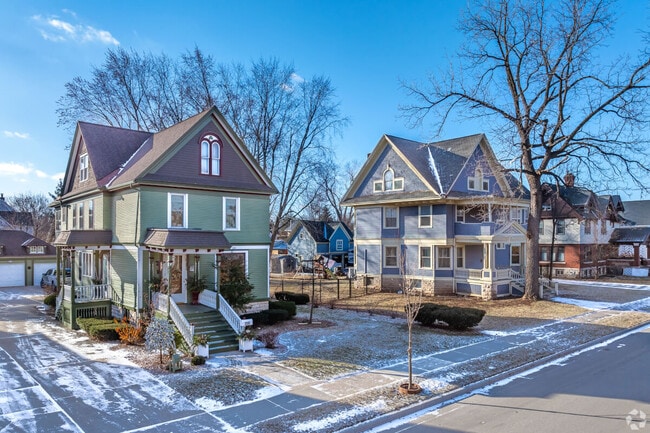
Gorgeous older homes in Fond Du Lac are found near the downtown neighborhood.
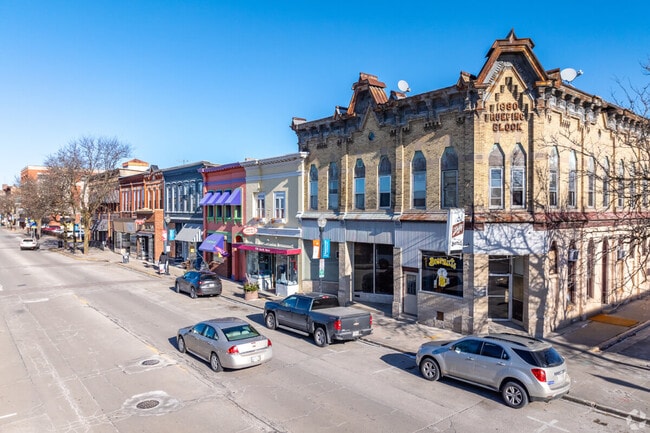
Main St of Fond du Lac has many historic buildings.
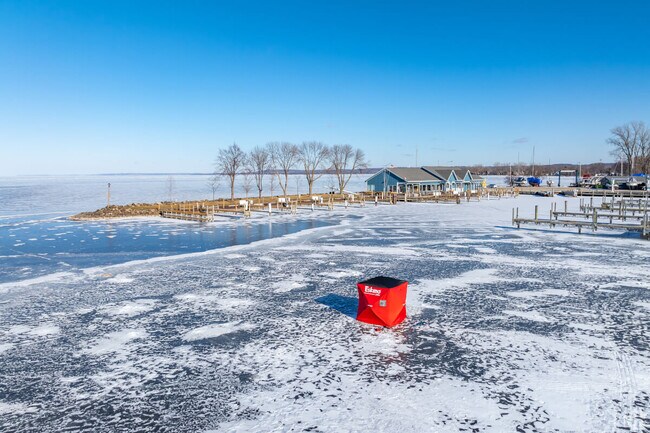
Ice fishing at Lakeside Park in Fond du Lac is very popular.
Median Household Income
$60,478
Average: $73,419
Education
8,646
Residents Have a Degree
Job Market
22,338
Workers Employed
Median Age
40 Years
Largest Age Group
35-44 Years
Approximately 14% of Residents
Under 20
23%
Over 65
20%
Housing Distribution
Fond Du Lac has more homeowners than renters.

Education Distribution
Review this city's overall education levels.

As of June 2026, the average apartment rent in Fond Du Lac, WI is $682 for a studio, $1,084 for one bedroom, $1,165 for two bedrooms, and $1,136 for three bedrooms. Apartment rent in Fond Du Lac has increased by 14.0% in the past year.
The cost of living in Fond Du Lac, WI is 10.1% lower than the national average. Generally, housing in Fond Du Lac is 26.3% less expensive than the national average, with rent falling between $682 - $1,165. You can expect to pay 2.7% less for groceries, 7.4% less for utilities, and 5.0% less for transportation.
Compare Cities
Explore how walkable, bikeable, drivable, and transit-friendly Fond Du Lac, WI is for everyday living.
Fairly Walkable
Walkability
Very Drivable
Drivability
Fairly Bikeable
Bikeability
Public
Grades PK-5
398 Students

Public
Grades PK-5
398 Students
Public
Grades PK-5
364 Students
Public
Grades PK-5
364 Students
Public
Grades PK-5
273 Students
Public
Grades 6-8
438 Students

Public
Grades 6-8
438 Students
Public
Grades 6-8
463 Students

Public
Grades 6-8
463 Students
Public
Grades K-12
154 Students
Public
Grades K-12
154 Students
Public
Grades 9-12
2,006 Students

Public
Grades 9-12
2,006 Students
† Our analysis of utilities, groceries, transportation, healthcare, home prices, and other goods and services is sourced from the Cost of Living Index, a respected benchmark published by the Council for Community and Economic Research (C2ER) that provides a thorough overview of living expenses across different regions.
Rent data is provided by CoStar Group’s Market Trend reports. As the industry leader in commercial real estate information, analytics, and news, CoStar conducts extensive research to produce and maintain a comprehensive database of commercial real estate information. We combine this data with public record to provide the most up-to-date rental information available.
Consumer goods, services, and home prices are sourced from the Cost of Living Index published by the Council for Community and Economic Research (C2ER). The data on this page is updated quarterly. It was last published in June 2026.
Demographic information comes from Neustar and combines detailed address data with U.S. Census and American Community Survey statistics to produce reliable local estimates.


