Median Age
41 Years
Largest Age Group
30-39 Years
Approximately 17% of Residents
Under 20
21%
Over 65
20%
Avg Rent
$1,117
Population
10,272
Renter Mix
43% Rent
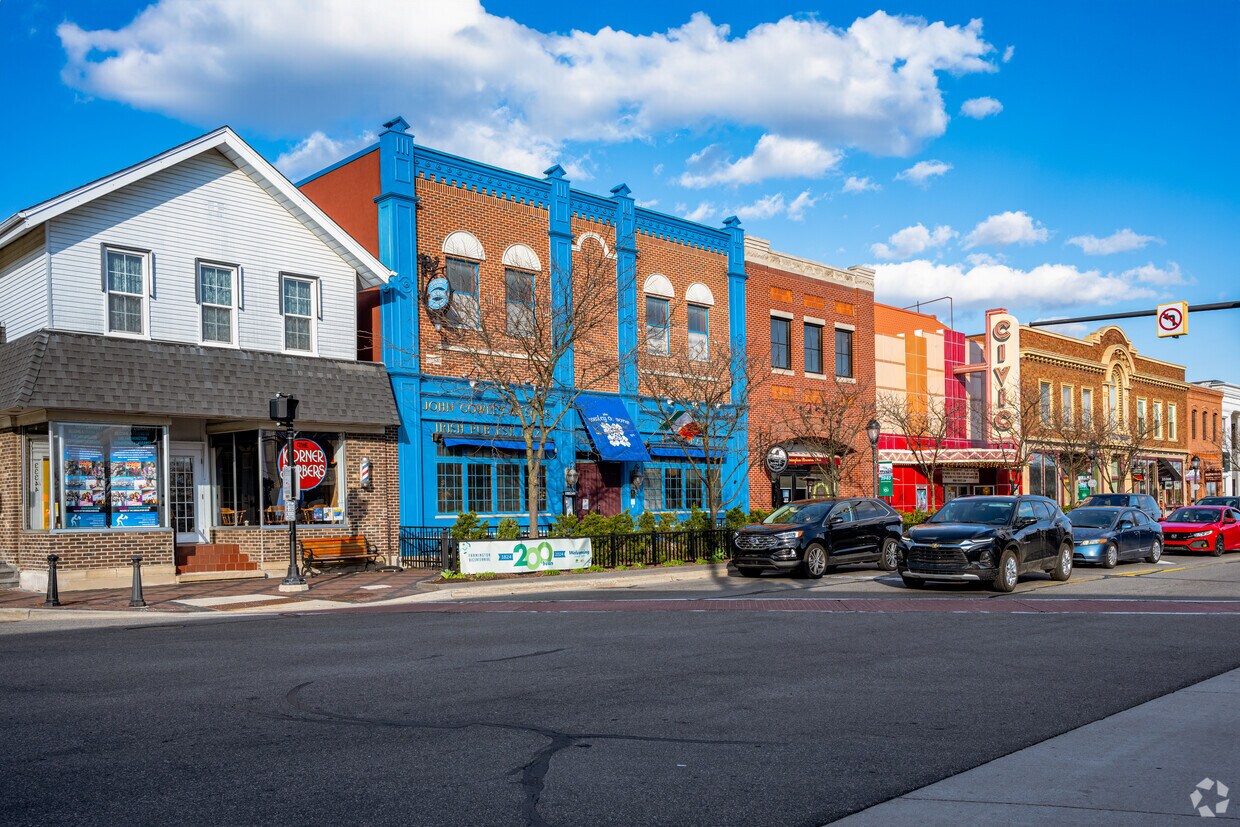
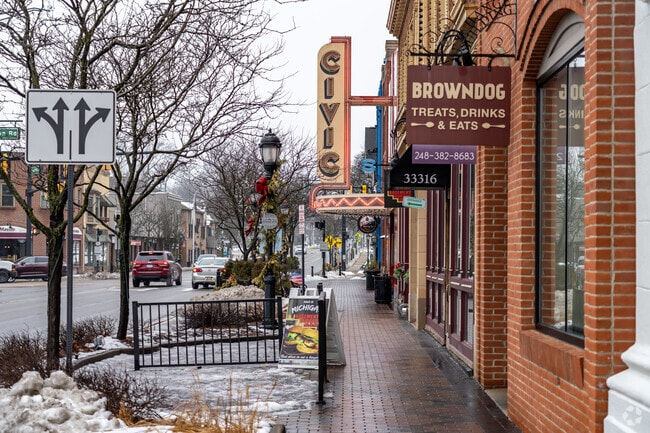
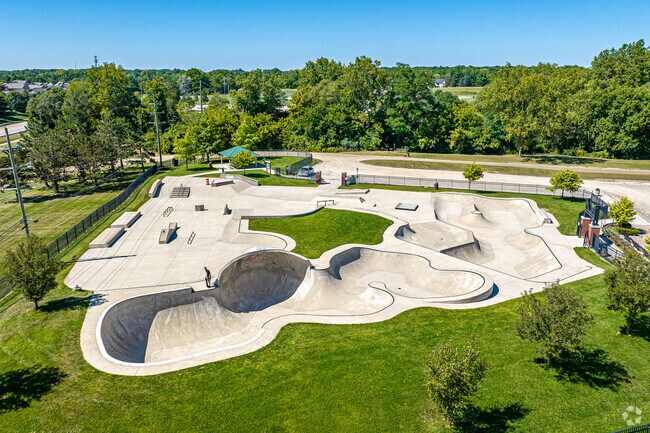
Farmington, Michigan is a small city with a downtown that actually earns that description — lined with specialty shops, independent eateries, and a historic cinema where the Farmington Civic Theater still shows films in a beautifully preserved space. Nestled in Oakland County and surrounded by Farmington Hills, this tight-knit community sits roughly equidistant between Detroit and Ann Arbor, making it a natural landing spot for anyone who wants quick access to two major metros without giving up a quieter pace of life. Riley Park anchors the heart of downtown and hosts Rhythmz in Riley Park, a beloved outdoor summer concert series that draws crowds year after year. Shiawassee Park adds to the city's green footprint with walkable trails worth exploring in any season.
Founded in 1824 by Quaker settlers, Farmington carries its history lightly — Victorian-style homes dot the residential streets, giving the city a sense of architectural character that newer suburbs simply don't have. Renters here will find a solid mix of apartment communities and townhome-style rentals, with options that suit a range of needs and lifestyles. With Routes 5, I-275, and I-696 nearby, getting around the broader metro area is genuinely straightforward.
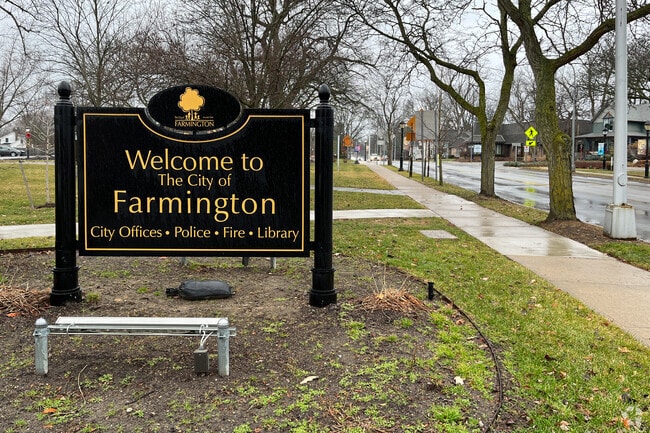
City Hall Park sign welcomes people to Farmington.
Riley Park features a 29,000-square-foot skate park.
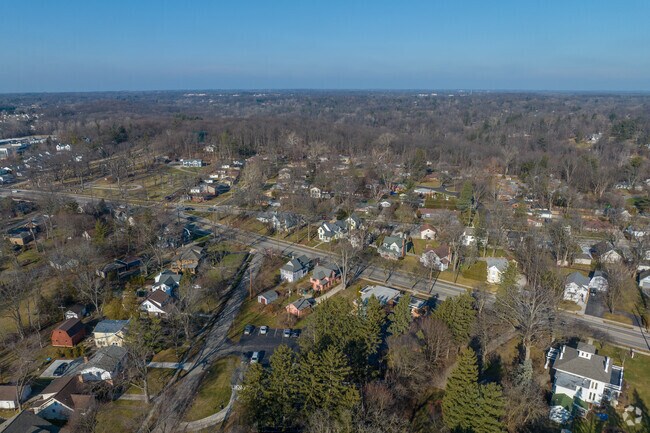
Farmington Historic District aerial shot shows some of the neighborhoods in frame.
Residents frequent local businesses in Farmington.
The Farmington Historic District near downtown Farmington contains some of its oldest homes.
The Farmington Hills Nature Center features several outdoor trails to walk or jog along.
Median Household Income
$90,941
Average: $111,858
Education
4,807
Residents Have a Degree
Job Market
5,569
Workers Employed
Median Age
41 Years
Largest Age Group
30-39 Years
Approximately 17% of Residents
Under 20
21%
Over 65
20%
Housing Distribution
Farmington has more homeowners than renters.

Education Distribution
Review this city's overall education levels.

As of July 2026, the average apartment rent in Farmington, MI is $762 for a studio, $1,117 for one bedroom, $1,339 for two bedrooms, and $1,321 for three bedrooms. Apartment rent in Farmington has increased by 2.1% in the past year.
Explore how walkable, bikeable, drivable, and transit-friendly Farmington, MI is for everyday living.
Fairly Walkable
Walkability
Limited Public Transit
Transit
Exceptionally Drivable
Drivability
Fairly Bikeable
Bikeability
Public
Grades K-5
395 Students

Public
Grades PK-5
525 Students

Public
Grades K-12
70 Students
Public
Grades K-12
70 Students
Public
Grades 9-12
1,500 Students
Public
Grades 9-12
85 Students

Public
Grades K-12
70 Students
† Our analysis of utilities, groceries, transportation, healthcare, home prices, and other goods and services is sourced from the Cost of Living Index, a respected benchmark published by the Council for Community and Economic Research (C2ER) that provides a thorough overview of living expenses across different regions.
Rent data is provided by CoStar Group’s Market Trend reports. As the industry leader in commercial real estate information, analytics, and news, CoStar conducts extensive research to produce and maintain a comprehensive database of commercial real estate information. We combine this data with public record to provide the most up-to-date rental information available.
Consumer goods, services, and home prices are sourced from the Cost of Living Index published by the Council for Community and Economic Research (C2ER). The data on this page is updated quarterly. It was last published in June 2026.
Demographic information comes from Neustar and combines detailed address data with U.S. Census and American Community Survey statistics to produce reliable local estimates.


