Median Age
38 Years
Largest Age Group
25-34 Years
Approximately 14% of Residents
Under 20
26%
Over 65
20%

Avg Rent
$1,551
Population
32,164
Renter Mix
40% Rent
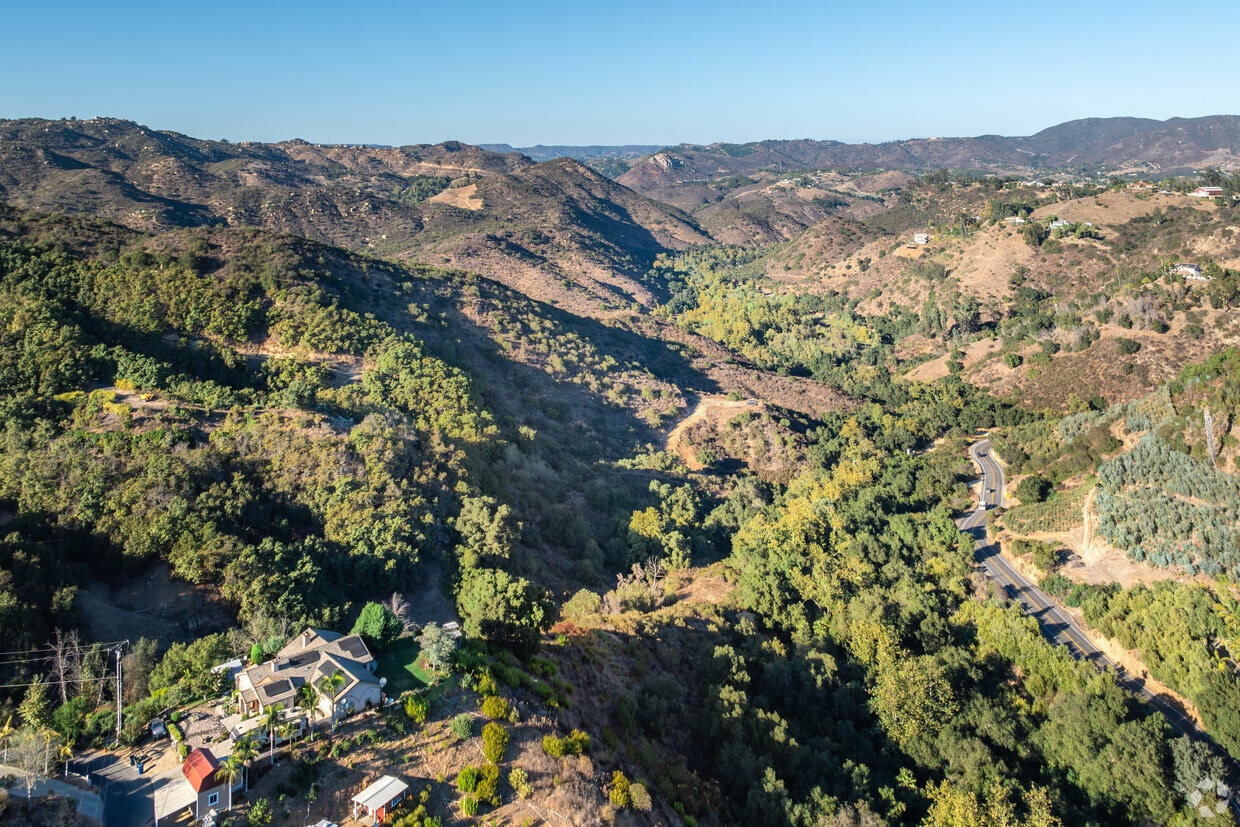
Fallbrook wears its nickname proudly — the Avocado Capital of the World — and the rolling groves draped across its northern San Diego County hills make that title feel completely earned. Tucked just east of Camp Pendleton, this unincorporated community of roughly 32,000 carries a laid-back, small-town rhythm that sets it apart from the faster pace of coastal Southern California. The annual Avocado Festival draws visitors from across the region every spring, filling downtown streets with a classic car show, live music, and plenty of local flavor. Agriculture, the nearby Marine base, and connections to the broader San Diego economy all shape daily life here.
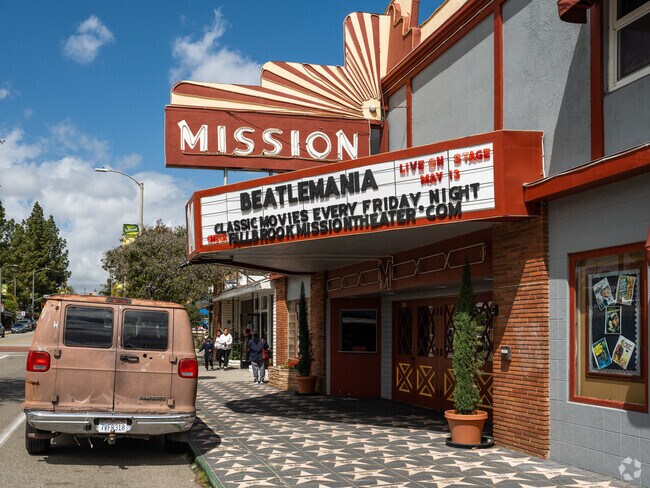
The housing mix leans toward single-family homes and smaller apartment communities nestled into the area's hillside terrain, giving most rentals a quieter, more residential feel. Townhomes and garden-style units round out the options for those seeking more space without the density of city living. Neighborhoods range from walkable stretches near Main Street's shops and the historic Mission Theatre to more rural pockets surrounded by orchards. Interstate 15 provides a reliable link north to Temecula and south toward Escondido and San Diego, making Fallbrook a practical base for those who want open skies without losing access to a major metro.
FallBrook Mission Theater Offers Award Winning Films from all Genres
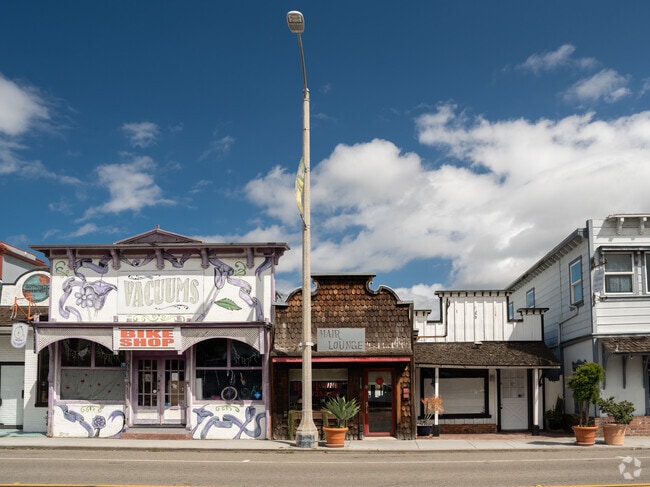
Fallbrook Offers Eclectic Charming Buildings from Turn of The Century Mining Era
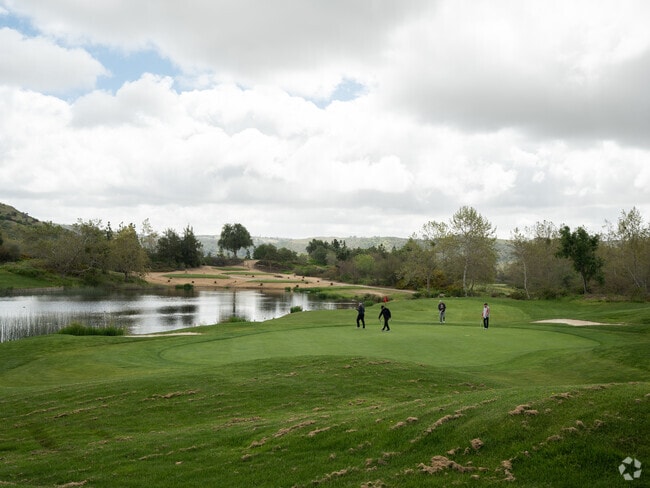
Enjoy the outdoors at the Santa Margarita River.
Easily connect to the train from Fallbrook at the Vista Transit Center.
Fallbrook is known for its expansive equestrian properties.
Spacious Hacienda-style homes, built in the 2010s, are found throughout Fallbrook.
Median Household Income
$77,396
Average: $101,997
Education
7,013
Residents Have a Degree
Job Market
14,247
Workers Employed
Median Age
38 Years
Largest Age Group
25-34 Years
Approximately 14% of Residents
Under 20
26%
Over 65
20%
Housing Distribution
Fallbrook has more homeowners than renters.

Education Distribution
Review this city's overall education levels.

As of July 2026, the average apartment rent in Fallbrook, CA is $1,383 for a studio, $1,551 for one bedroom, $1,802 for two bedrooms, and $2,154 for three bedrooms. Apartment rent in Fallbrook has increased by 1.7% in the past year.
Explore how walkable, bikeable, drivable, and transit-friendly Fallbrook, CA is for everyday living.
Somewhat Walkable
Walkability
Exceptionally Drivable
Drivability
Somewhat Bikeable
Bikeability
Public
Grades K-5
499 Students

Public
Grades K-5
499 Students
Public
Grades K-5
717 Students

Public
Grades K-5
717 Students
Public
Grades K-5
560 Students

Public
Grades 6-8
828 Students

Public
Grades 9-12
1,853 Students

Public
Grades 9-12
1,853 Students
† Our analysis of utilities, groceries, transportation, healthcare, home prices, and other goods and services is sourced from the Cost of Living Index, a respected benchmark published by the Council for Community and Economic Research (C2ER) that provides a thorough overview of living expenses across different regions.
Rent data is provided by CoStar Group’s Market Trend reports. As the industry leader in commercial real estate information, analytics, and news, CoStar conducts extensive research to produce and maintain a comprehensive database of commercial real estate information. We combine this data with public record to provide the most up-to-date rental information available.
Consumer goods, services, and home prices are sourced from the Cost of Living Index published by the Council for Community and Economic Research (C2ER). The data on this page is updated quarterly. It was last published in June 2026.
Demographic information comes from Neustar and combines detailed address data with U.S. Census and American Community Survey statistics to produce reliable local estimates.


