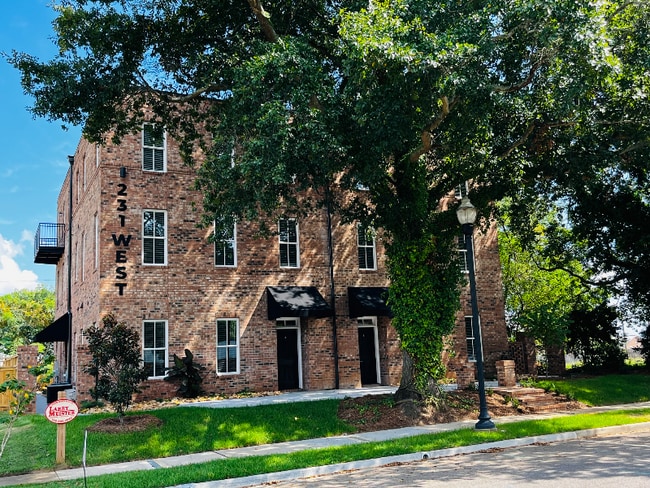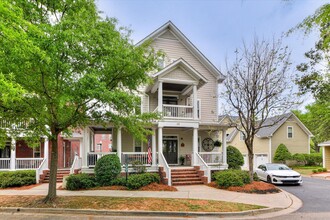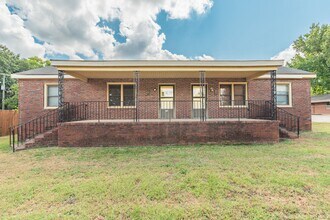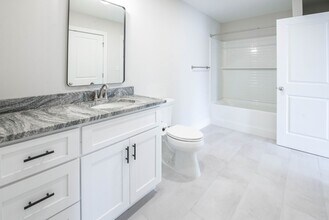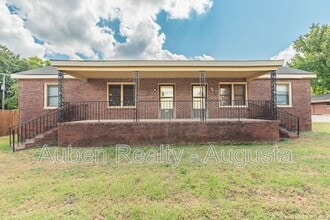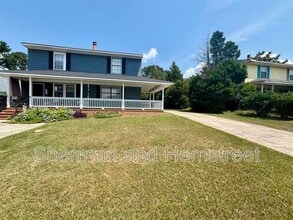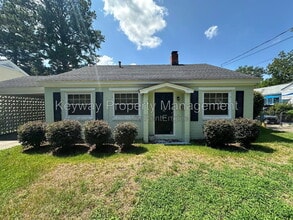
The Ironwood Apartments
339 Railroad Ave,
North Augusta, SC 29841
$1,392 - $2,182
1-3 Beds

Area Guide
The entertainment center of North Augusta nearly mirrors the city on the other side of the Savannah River. With convenient access to Augusta and other big cities through major highways in town, North Augusta is a fantastic location for commuters and frequent travelers.
Buena Vista Avenue and Georgia Avenue serve as the main thoroughfares throughout Downtown North Augusta, and they hold a number of quaint cafes and locally owned shops. With large riverfront golf courses like the River Golf Club, retail stores, and local businesses, North Augusta has it all. Enjoy large waterfront parks like Brick Pond Park with hiking trails and wildlife watching opportunities. The amenities of Augusta and the great state of Georgia lie just five minutes from your Downtown North Augusta rental.
As of August 2026, the average apartment rent in Downtown North Augusta is $1,596 for one bedroom, $2,173 for two bedrooms, and $2,176 for three bedrooms. Apartment rent in Downtown North Augusta has decreased by -0.6% in the past year.
1 BR
719 sq ft
Average Sq Ft
$1,596/month
Average Rent
2 BR
1,143 sq ft
Average Sq Ft
$2,173/month
Average Rent
3 BR
1,394 sq ft
Average Sq Ft
$2,176/month
Average Rent
Explore how walkable, bikeable, drivable, and transit-friendly Downtown North Augusta - North Augusta, SC is for everyday living.
Fairly Walkable
Walkability
Very Drivable
Drivability
Fairly Bikeable
Bikeability
Downtown North Augusta - North Augusta, SC offers all daily essentials, but they’re limited to a few main areas.
Supermarket Within a 15 Minute Walk
Groceries
Great Restaurant Variety Nearby
Restaurants
Good Café Variety Nearby
Cafes
Good Variety of Shops Nearby
Shopping
Get a sense of what it’s like to live in Downtown North Augusta - North Augusta, SC from everyday activity to noise and nightlife.
Mostly Calm Atmosphere
Vibrancy
Good Nightlife Variety Nearby
Nightlife
Very Noisy
Quiet Score

† Our analysis of utilities, groceries, transportation, healthcare, home prices, and other goods and services is sourced from the Cost of Living Index, a respected benchmark published by the Council for Community and Economic Research (C2ER) that provides a thorough overview of living expenses across different regions.
Rent data is provided by CoStar Group’s Market Trend reports. As the industry leader in commercial real estate information, analytics, and news, CoStar conducts extensive research to produce and maintain a comprehensive database of commercial real estate information. We combine this data with public record to provide the most up-to-date rental information available.
Consumer goods, services, and home prices are sourced from the Cost of Living Index published by the Council for Community and Economic Research (C2ER). The data on this page is updated quarterly. It was last published in June 2026.
Demographic information comes from Neustar and combines detailed address data with U.S. Census and American Community Survey statistics to produce reliable local estimates.