
The Prairies Apartment Homes
4555 N Arlington,
Indianapolis, IN 46226
$909 - $1,379
1-3 Beds

Area Guide
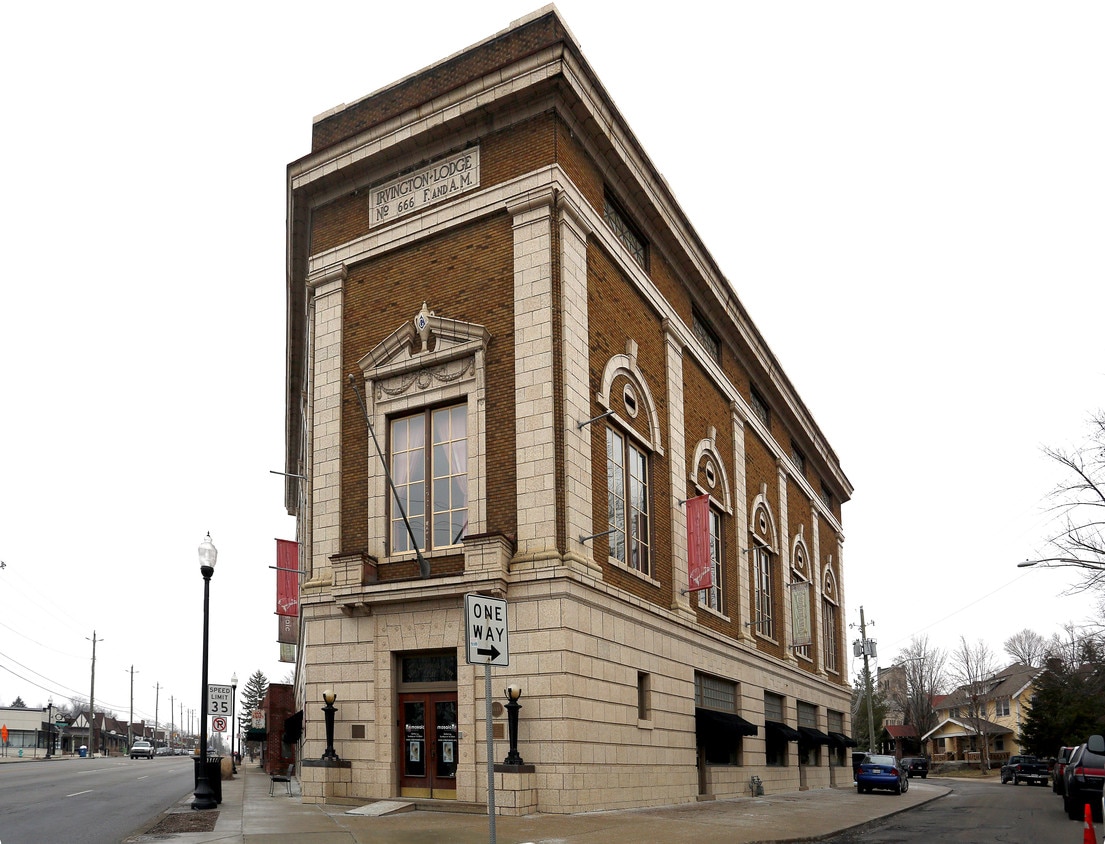
Devington is located about eight miles northeast of Mile Square, Indianapolis’ downtown district. Indianapolis is one of the most affordable places to live in the country and Devington follows suit. Along with its affordability, Devington is known for its close-knit feel. The Devington Communities Association hosts a variety of events. There is a wide range of apartments, houses, and condos available at lower rate compared to other Indianapolis neighborhoods. Devington has several shopping plazas, restaurants, parks, and schools. Renters also appreciate being a short drive away from Fort Harrison State Park and the Indiana State Fairgrounds. Great for commuters, Devington is near Interstate 70 and 465, allowing for easy travels throughout the city.
As of June 2026, the average apartment rent in Devington is $832 for one bedroom, $1,093 for two bedrooms, and $1,337 for three bedrooms. Apartment rent in Devington has increased by 1.8% in the past year.
1 BR
769 sq ft
Average Sq Ft
$832/month
Average Rent
2 BR
904 sq ft
Average Sq Ft
$1,093/month
Average Rent
3 BR
1,129 sq ft
Average Sq Ft
$1,337/month
Average Rent
Explore how walkable, bikeable, drivable, and transit-friendly Devington - Indianapolis, IN is for everyday living.
Fairly Walkable
Walkability
Limited Public Transit
Transit
Exceptionally Drivable
Drivability
Fairly Bikeable
Bikeability
Essentials are more spread out in Devington - Indianapolis, IN, so everyday errands require more planning.
No Supermarkets Within a 30 Minute Walk
Groceries
Fair Restaurant Variety Nearby
Restaurants
Few to No Café Options Nearby
Cafes
Fair Variety of Shops Nearby
Shopping
Recreation options in Devington - Indianapolis, IN are limited, so staying active may require more planning.
Moderate Amount of Park Space Nearby
Parks
Few to No Wellness Amenity Options Nearby
Wellness
Get a sense of what it’s like to live in Devington - Indianapolis, IN from everyday activity to noise and nightlife.
Mostly Calm Atmosphere
Vibrancy
Few to No Nightlife Options Nearby
Nightlife
Moderately Noisy
Quiet Score
† Our analysis of utilities, groceries, transportation, healthcare, home prices, and other goods and services is sourced from the Cost of Living Index, a respected benchmark published by the Council for Community and Economic Research (C2ER) that provides a thorough overview of living expenses across different regions.
Rent data is provided by CoStar Group’s Market Trend reports. As the industry leader in commercial real estate information, analytics, and news, CoStar conducts extensive research to produce and maintain a comprehensive database of commercial real estate information. We combine this data with public record to provide the most up-to-date rental information available.
Consumer goods, services, and home prices are sourced from the Cost of Living Index published by the Council for Community and Economic Research (C2ER). The data on this page is updated quarterly. It was last published in June 2026.
Demographic information comes from Neustar and combines detailed address data with U.S. Census and American Community Survey statistics to produce reliable local estimates.


