Median Age
40 Years
Largest Age Group
20-29 Years
Approximately 13% of Residents
Under 20
25%
Over 65
21%


Avg Rent
$714
Population
69,099
Renter Mix
42% Rent
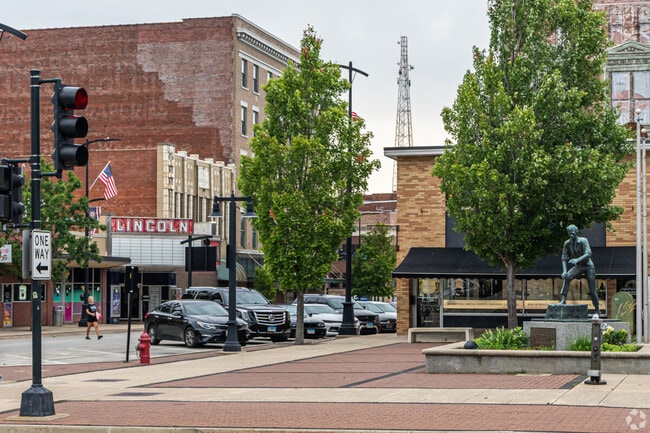
The largest city in Illinois, Decatur sits in the heart of the state along Lake Decatur. Historic sites, local attractions, and abundant affordable apartments and houses for rent define this sprawling suburb. Along Main Street you’ll find historic landmarks, local cafes, restaurants, bars, and shops. Easy access to Interstate 72 connects residents to nearby cities including Springfield and Champaign. Residents and visitors alike enjoy visiting Nelson Park on the lake, as well as the Scovill Zoo and Children’s Museum of Illinois. Decatur offers a welcoming community, great public schools, and a sense of small-town charm.
The sunset over the Johns Hill neighborhood in Decatur, IL.
The Johns Hill community celebrates Abraham Lincoln, who started his political career in Decatur.
The Central Park Farmers Market offers many items from local vendors.
Median Household Income
$42,212
Average: $59,338
Education
12,640
Residents Have a Degree
Job Market
29,101
Workers Employed
Median Age
40 Years
Largest Age Group
20-29 Years
Approximately 13% of Residents
Under 20
25%
Over 65
21%
Housing Distribution
Decatur has more homeowners than renters.

Education Distribution
Review this city's overall education levels.

As of July 2026, the average apartment rent in Decatur, IL is $564 for a studio, $715 for one bedroom, $903 for two bedrooms, and $1,169 for three bedrooms. Apartment rent in Decatur has increased by 2.7% in the past year.
The cost of living in Decatur, IL is 19.8% lower than the national average. Generally, housing in Decatur is 49.5% less expensive than the national average, with rent falling between $564 - $1,169. You can expect to pay 2.3% less for groceries, 5.6% more for utilities, and 5.7% less for transportation.
Compare Cities
Explore how walkable, bikeable, drivable, and transit-friendly Decatur, IL is for everyday living.
Fairly Walkable
Walkability
Exceptionally Drivable
Drivability
Fairly Bikeable
Bikeability
Public
Grades K-8
628 Students

Public
Grades PK-8
609 Students
South Shores Elementary School
Public
Grades K-5
322 Students
Public
Grades PK-8
315 Students
Public
Grades K-5
373 Students

Public
Grades K-8
628 Students
Public
Grades PK-8
609 Students
Public
Grades PK-8
315 Students
Public
Grades PK-8
556 Students

Public
Grades K-8
519 Students
Public
Grades 9-12
1,012 Students
Public
Grades 9-12
860 Students
Public
Grades PK-12
2 Students

Public
Grades 9-12
Public
Grades 9-12
† Our analysis of utilities, groceries, transportation, healthcare, home prices, and other goods and services is sourced from the Cost of Living Index, a respected benchmark published by the Council for Community and Economic Research (C2ER) that provides a thorough overview of living expenses across different regions.
Rent data is provided by CoStar Group’s Market Trend reports. As the industry leader in commercial real estate information, analytics, and news, CoStar conducts extensive research to produce and maintain a comprehensive database of commercial real estate information. We combine this data with public record to provide the most up-to-date rental information available.
Consumer goods, services, and home prices are sourced from the Cost of Living Index published by the Council for Community and Economic Research (C2ER). The data on this page is updated quarterly. It was last published in June 2026.
Demographic information comes from Neustar and combines detailed address data with U.S. Census and American Community Survey statistics to produce reliable local estimates.


