
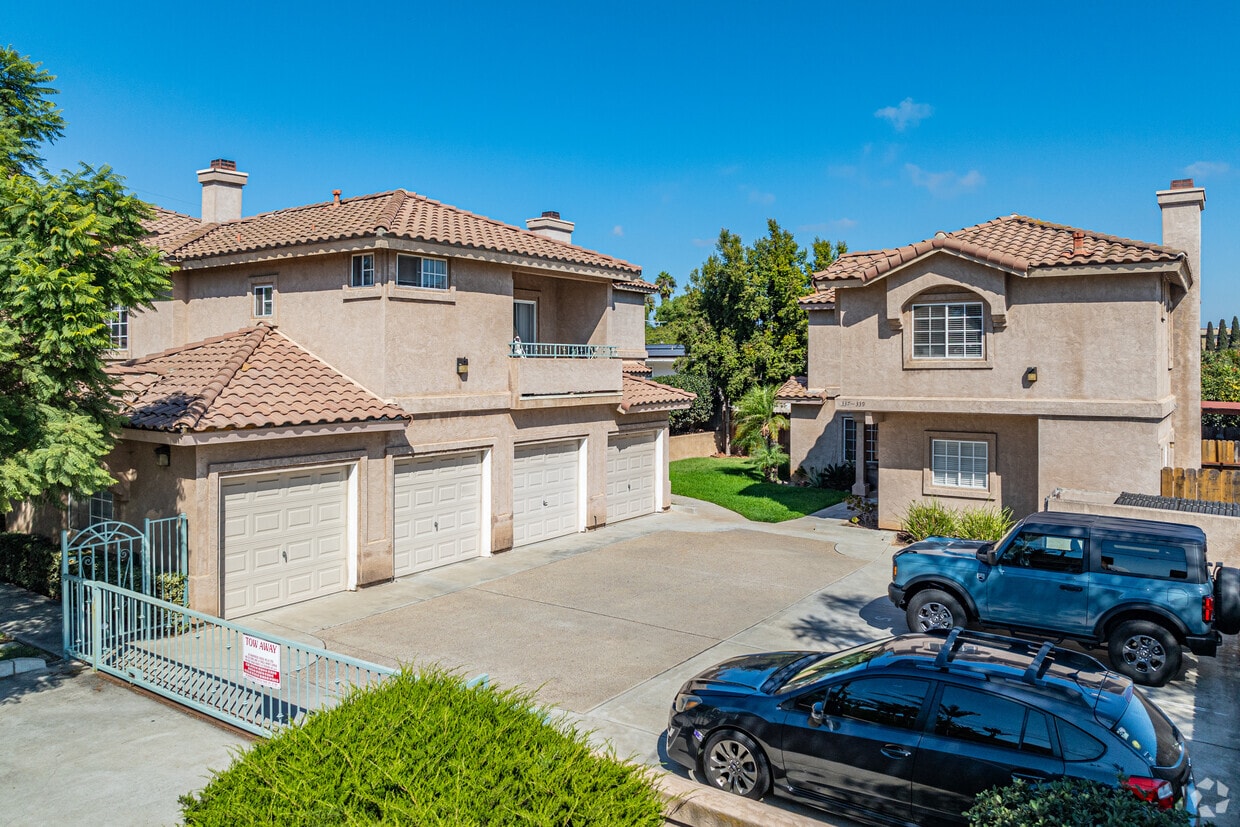
Del Oro on Broadway
986 Broadway,
Chula Vista, CA 91911
$2,595 - $3,445
1-2 Beds

Between San Diego Bay and coastal mountain foothills, Chula Vista offers the scenic beauty its Spanish name promises. This South Bay community combines city conveniences with natural surroundings. The rental market shows steady growth, with current average rents ranging from $1,830 for studios to $4,477 for four-bedroom homes, representing a modest year-over-year increase between 1.1% to 11.3%. Housing options span from waterfront apartments near the marina to residential communities in the Eastlake neighborhood, known for its mountain views.
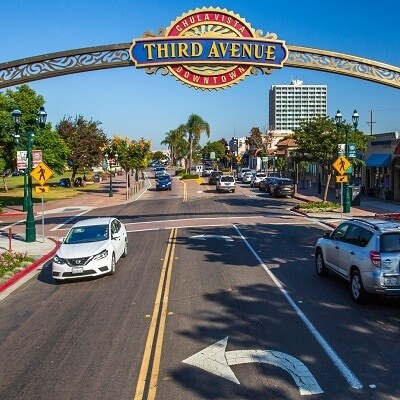
Outdoor recreation and cultural attractions abound throughout the city. The Living Coast Discovery Center provides hands-on marine life experiences, while Otay Valley Regional Park offers miles of hiking and biking trails. Historic Third Avenue Village hosts community gatherings, including the Lemon Festival that pays tribute to the area's agricultural heritage. The North Island Credit Union Amphitheatre brings major touring acts to the region, while the Elite Athlete Training Center continues its legacy of athletic excellence. Located between downtown San Diego and the Mexican border, Chula Vista provides convenient access to regional employment centers via Interstate 805, while offering local shopping at Chula Vista Center.
Bayside Park provides great views along with picnic areas, hiking trails and a fishing pier
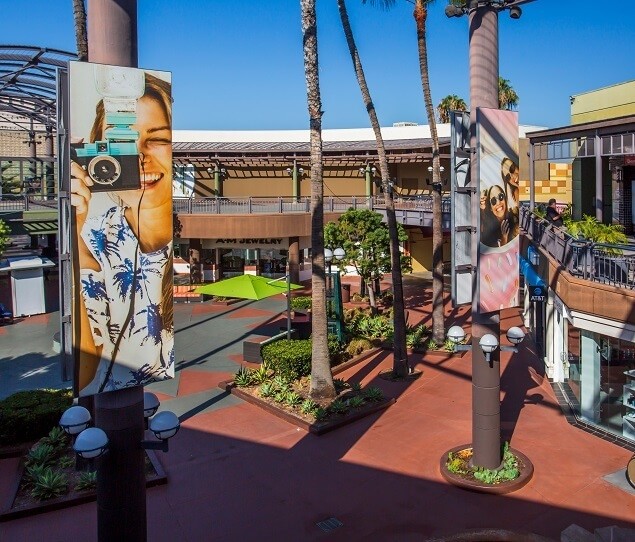
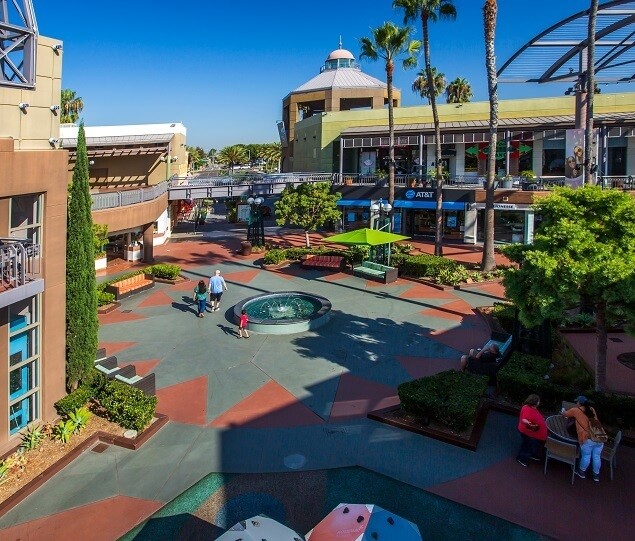
Chula Vista Center opened in 1962
The outdoor shopping mall Chula Vista Center is home to more than 79 stores
With its beautiful views, Chula Vista Marina is a popular destination
Memorial Park, located in downtown Chula Vista, has an amphitheater, a playground, and a gym
12-acre Mountain Hawk Park features a splash pad, a playground, picnic areas, and trails
As of March 2026, the average apartment rent in Chula Vista, CA is $1,823 for a studio, $2,155 for one bedroom, $2,674 for two bedrooms, and $3,676 for three bedrooms. Apartment rent in Chula Vista has decreased by -0.9% in the past year.
Explore how walkable, bikeable, drivable, and transit-friendly Chula Vista, CA is for everyday living.
Very Walkable
If you enjoy walking, you’ll enjoy renting in this area! It’s a very walkable neighborhood.
Some Transit
You'll likely want a car when living in this area since it has few transit options.
Bikeable
While there’s some bike infrastructure in this area, you’ll still need a car for many errands.
Public
Grades K-5

Public
Grades K-8
Public
Grades K-5
Public
Grades K-5

Public
Grades K-5
Public
Grades K-8
Public
Grades K-8
Chula Vista Learning Community Charter School
Public
Grades K-12

Howard Gardner Community Charter
Public
Grades K-8

Public
Grades 6-8

Public
Grades 9-12
Public
Grades 9-12
Public
Grades 9-12
High Tech High Chula Vista School
Public
Grades 9-12
Public
Grades 9-12

3,490
Communities
959,772
Units
895
Cities

24
Communities
3,042
Units
8
Cities

54
Communities
4,425
Units
15
Cities

31
Communities
2,354
Units
16
Cities

12
Communities
472
Units
2
Cities

92
Communities
10,200
Units
38
Cities
† Our analysis of utilities, groceries, transportation, healthcare, home prices, and other goods and services is sourced from the Cost of Living Index, a respected benchmark published by the Council for Community and Economic Research (C2ER) that provides a thorough overview of living expenses across different regions.
Rent data is provided by CoStar Group’s Market Trend reports. As the industry leader in commercial real estate information, analytics, and news, CoStar conducts extensive research to produce and maintain a comprehensive database of commercial real estate information. We combine this data with public record to provide the most up-to-date rental information available.
Consumer goods, services, and home prices are sourced from the Cost of Living Index published by the Council for Community and Economic Research (C2ER). The data on this page is updated quarterly. It was last published in February 2026.


