Median Age
33 Years
Largest Age Group
10-19 Years
Approximately 17% of Residents
Under 20
30%
Over 65
12%

Avg Rent
$1,343
Population
48,768
Renter Mix
37% Rent
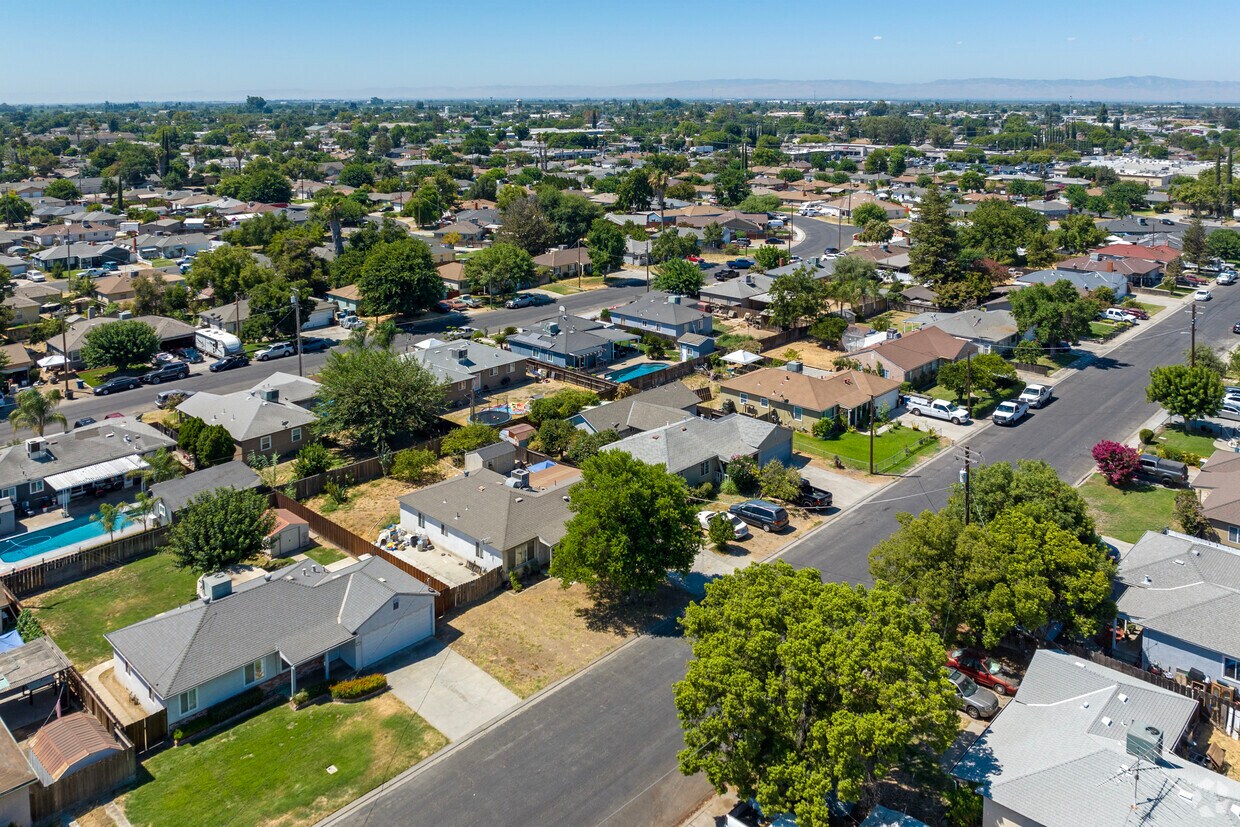
Named after the Roman goddess of agriculture, Ceres sits at the southern edge of Modesto in the heart of California’s San Joaquin Valley, where a slower pace of life meets easy access to bigger-city amenities. Everyday essentials are close at hand, and State Route 99 makes the commute into neighboring Modesto straightforward for museum visits, dining, and entertainment. Day trips to Sacramento, the Bay Area, Yosemite National Park, and the San Luis National Wildlife Refuge are all within reach for outdoor escapes.
The rental market here leans toward single-story homes and garden-style apartment communities that feel more residential than urban. Townhomes and multi-bedroom layouts are common, offering more square footage than many coastal markets at comparable price points. Local pride runs deep—reflected in the long-running Ceres Courier newspaper and community events—so newcomers find a friendly, small-city feel with practical conveniences and regional connectivity.
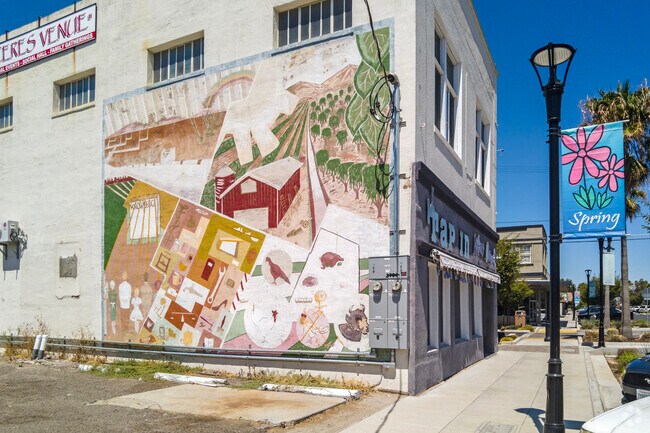
Colorful murals adorn the walls of businesses on 4th Street in Ceres.
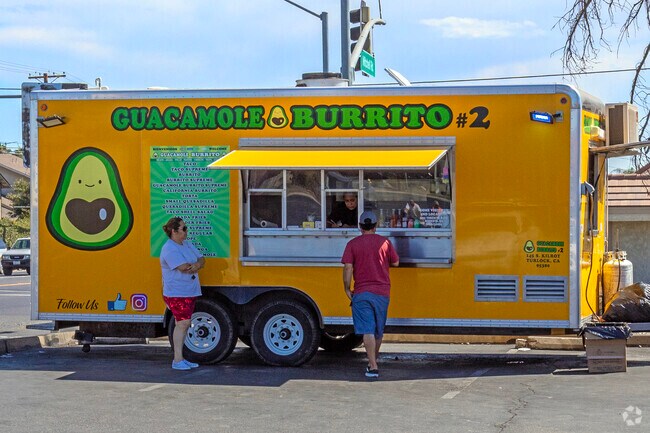
Food trucks are a popular lunch option in Ceres.
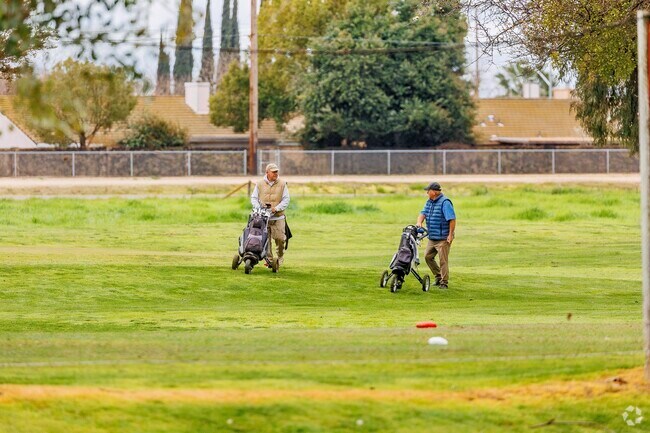
Play a round of golf at River Oak Golf Course.
A clock stands in the historic 4th Street area of Ceres.
Come and enjoy local bands at Downtown Ceres Concert in the Park.
Take a stroll at Smyrna Park, past a playground, skatepark, and sports fields.
Median Household Income
$71,434
Average: $85,560
Education
5,332
Residents Have a Degree
Job Market
20,558
Workers Employed
Median Age
33 Years
Largest Age Group
10-19 Years
Approximately 17% of Residents
Under 20
30%
Over 65
12%
Housing Distribution
Ceres has more homeowners than renters.

Education Distribution
Review this city's overall education levels.

As of August 2026, the average apartment rent in Ceres, CA is $763 for a studio, $1,343 for one bedroom, $1,626 for two bedrooms, and $2,217 for three bedrooms. Apartment rent in Ceres has decreased by -1.1% in the past year.
Explore how walkable, bikeable, drivable, and transit-friendly Ceres, CA is for everyday living.
Fairly Walkable
Walkability
Limited Public Transit
Transit
Exceptionally Drivable
Drivability
Somewhat Bikeable
Bikeability
Public
Grades K-5
516 Students

Public
Grades K-5
516 Students
Public
Grades K-5
668 Students

Public
Grades K-5
581 Students
Joel J. Hidahl Elementary School
Public
Grades K-5
393 Students
Blaker-Kinser Junior High School
Public
Grades 6-8
603 Students

Public
Grades 6-8
636 Students

Mae Hensley Junior High School
Public
Grades 6-8
636 Students
Cesar Chavez Junior High School
Public
Grades 6-8
685 Students

Public
Grades 6-8
685 Students
Public
Grades 9-12
96 Students

Public
Grades 9-12
1,660 Students
Public
Grades 9-12
1,660 Students
Public
Grades 9-12
2,317 Students
Public
Grades 6-12
231 Students

† Our analysis of utilities, groceries, transportation, healthcare, home prices, and other goods and services is sourced from the Cost of Living Index, a respected benchmark published by the Council for Community and Economic Research (C2ER) that provides a thorough overview of living expenses across different regions.
Rent data is provided by CoStar Group’s Market Trend reports. As the industry leader in commercial real estate information, analytics, and news, CoStar conducts extensive research to produce and maintain a comprehensive database of commercial real estate information. We combine this data with public record to provide the most up-to-date rental information available.
Consumer goods, services, and home prices are sourced from the Cost of Living Index published by the Council for Community and Economic Research (C2ER). The data on this page is updated quarterly. It was last published in June 2026.
Demographic information comes from Neustar and combines detailed address data with U.S. Census and American Community Survey statistics to produce reliable local estimates.


