Median Age
31 Years
Largest Age Group
20-29 Years
Approximately 21% of Residents
Under 20
28%
Over 65
14%

Avg Rent
$1,001
Population
28,212
Renter Mix
58% Rent
Carrollton, GA is about 45 miles west of Atlanta and is the county seat of Carroll County, making it one of western Georgia's most recognized mid-size cities. The University of West Georgia, with around 13,000 students enrolled, and West Georgia Technical College are both major economic anchors here, and for renters, that translates to a city with real energy, solid amenities, and a strong local identity going back to 1829. Downtown centers on Adamson Square, where you'll find cafes, bars, and independent shops within an easy walk. The AMP Amphitheatre hosts live music, and the square itself is the kind of place where something is usually going on. Apartment hunters will find a solid mix of housing options — garden-style communities, townhomes, and smaller walk-up buildings — spread across the city. When you want to get outside, John Tanner State Park is just a short drive away with boating, swimming, and trails. Everyday shopping is easy too, with Chandler Crossing and Riverside Plaza both close to residential areas. Commuting is straightforward thanks to Interstate 20, which connects Carrollton to the broader Atlanta metro, typically under an hour away. Local jobs are anchored by the two colleges, along with healthcare, retail, and public sector employers throughout Carroll County. And compared to Atlanta and other larger Georgia cities, Carrollton's rental prices are notably more affordable, making it a practical choice whether you work locally or commute east.
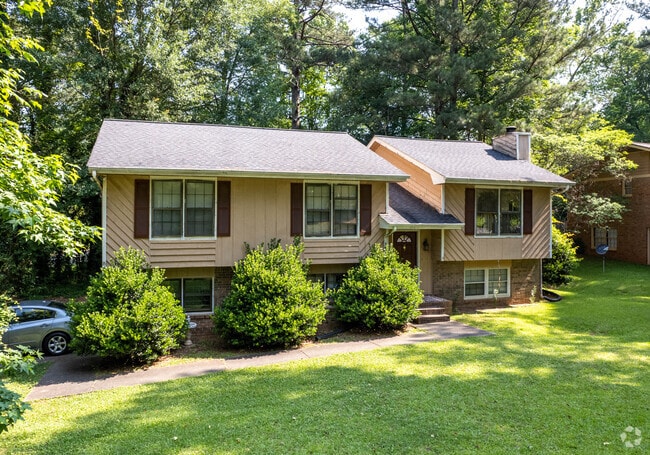
Split-level homes in Carrollton commonly have large front yards.
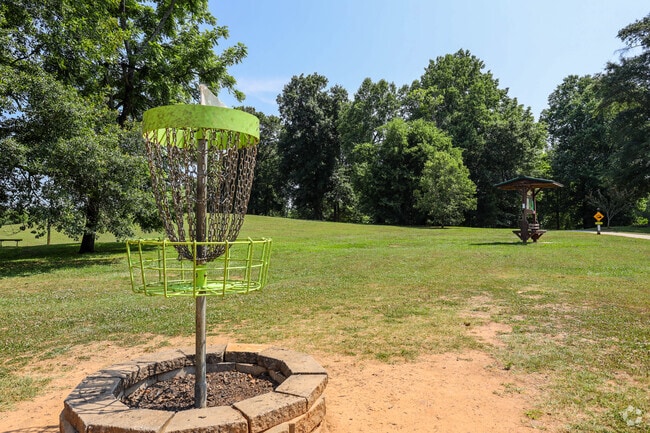
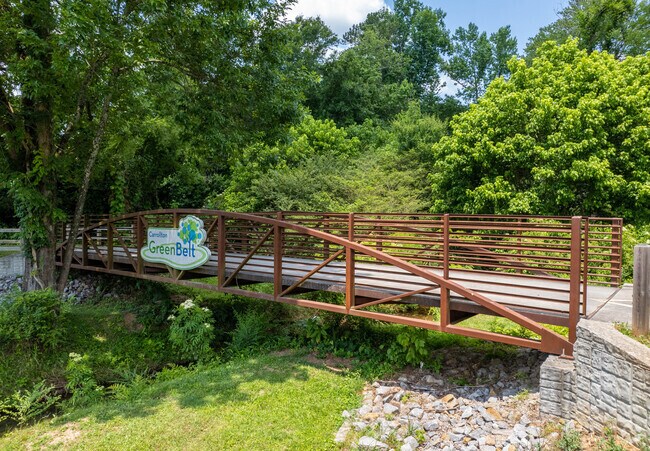
Carrollton's Greenbelt walking trails can take you anywhere within Carrollton.
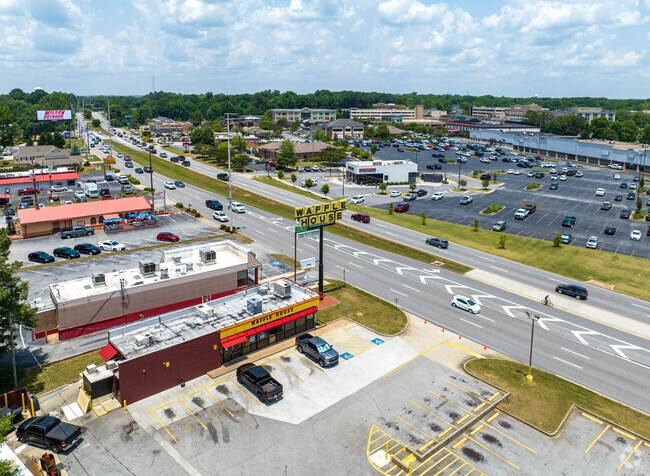
Carrollton has a busy downtown and retail area with restaurants, medical offices, and shopping.
Carrollton Center for the Arts displays artistic murals for everyone to view and enjoy.
Carrollton Center for the Arts hosts performances and exhibitions.
Carrollton has plenty of waterfront along lakes, streams, and ponds.
Median Household Income
$43,139
Average: $68,766
Education
6,052
Residents Have a Degree
Job Market
12,839
Workers Employed
Median Age
31 Years
Largest Age Group
20-29 Years
Approximately 21% of Residents
Under 20
28%
Over 65
14%
Housing Distribution
Carrollton has more renters than homeowners.

Education Distribution
Review this city's overall education levels.

As of July 2026, the average apartment rent in Carrollton, GA is $1,062 for a studio, $1,001 for one bedroom, $1,225 for two bedrooms, and $1,377 for three bedrooms. Apartment rent in Carrollton has increased by 0.9% in the past year.
Explore how walkable, bikeable, drivable, and transit-friendly Carrollton, GA is for everyday living.
Fairly Walkable
Walkability
Exceptionally Drivable
Drivability
Fairly Bikeable
Bikeability
Public
Grades PK-5
995 Students

Public
Grades PK-5
1,886 Students

Carrollton Middle-Upper Elementary School
Public
Grades K-5
867 Students

Public
Grades PK-5
608 Students
Public
Grades PK-5
744 Students

Public
Grades 6-8
988 Students
Public
Grades 6-8
1,305 Students
Public
Grades 6-8
384 Students
Public
Grades 9-12
1,324 Students
Public
Grades 9-12
502 Students
Public
Grades 9-12
1,875 Students
† Our analysis of utilities, groceries, transportation, healthcare, home prices, and other goods and services is sourced from the Cost of Living Index, a respected benchmark published by the Council for Community and Economic Research (C2ER) that provides a thorough overview of living expenses across different regions.
Rent data is provided by CoStar Group’s Market Trend reports. As the industry leader in commercial real estate information, analytics, and news, CoStar conducts extensive research to produce and maintain a comprehensive database of commercial real estate information. We combine this data with public record to provide the most up-to-date rental information available.
Consumer goods, services, and home prices are sourced from the Cost of Living Index published by the Council for Community and Economic Research (C2ER). The data on this page is updated quarterly. It was last published in June 2026.
Demographic information comes from Neustar and combines detailed address data with U.S. Census and American Community Survey statistics to produce reliable local estimates.


