Median Age
47 Years
Largest Age Group
65-74 Years
Approximately 14% of Residents
Under 20
18%
Over 65
27%


Avg Rent
$2,487
Population
11,287
Renter Mix
51% Rent
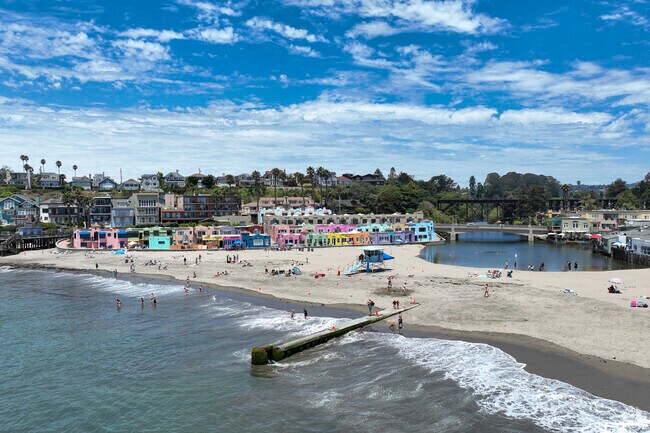
Capitola sits right where Soquel Creek meets Monterey Bay, making it one of the few cities in California where the beach is genuinely part of everyday life, not just a weekend destination. Covering just two square miles in Santa Cruz County, the city carries an easygoing coastal identity that feels different from the larger metros up the highway. San Jose is about 35 miles north, and San Francisco is roughly 75 miles away, so residents get the feel of a small seaside city without being cut off from major economic and employment hubs.
Capitola Village anchors the commercial heart of town, while quieter residential streets spread out toward the hills. The housing mix leans toward smaller-scale apartment communities, beach bungalows, and cottage-style rentals, though newer buildings have introduced more contemporary options. Established in the 1870s, Capitola holds the distinction of being one of the oldest seaside resort towns on the West Coast. The annual Begonia Festival, a tradition stretching back to 1950, reflects how deeply community identity is woven into the rhythm of life here.
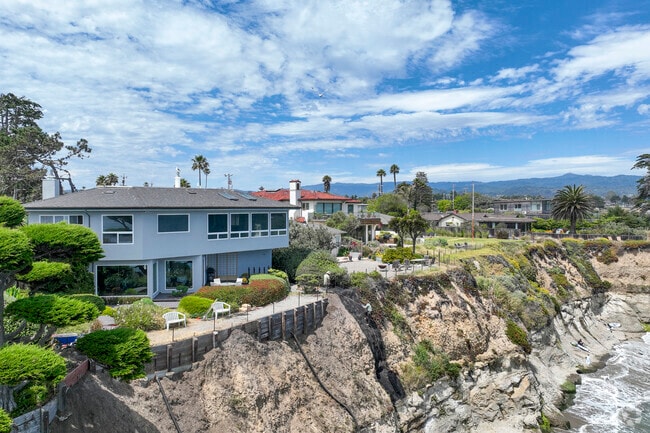
Pleasure Point has plenty of beachside homes.
Pleasure Point offers a wide variety of surf shops.
Median Household Income
$92,629
Average: $119,977
Education
4,505
Residents Have a Degree
Job Market
5,898
Workers Employed
Median Age
47 Years
Largest Age Group
65-74 Years
Approximately 14% of Residents
Under 20
18%
Over 65
27%
Housing Distribution
Capitola has more renters than homeowners.

Education Distribution
Review this city's overall education levels.

As of August 2026, the average apartment rent in Capitola, CA is $2,330 for a studio, $2,487 for one bedroom, $3,385 for two bedrooms, and $5,332 for three bedrooms. Apartment rent in Capitola has increased by 0.3% in the past year.
Explore how walkable, bikeable, drivable, and transit-friendly Capitola, CA is for everyday living.
Moderately Walkable
Walkability
Limited Public Transit
Transit
Exceptionally Drivable
Drivability
Moderately Bikeable
Bikeability
Public
Grades K-8
42 Students

Public
Grades 6-8
585 Students

Public
Grades K-8
42 Students
† Our analysis of utilities, groceries, transportation, healthcare, home prices, and other goods and services is sourced from the Cost of Living Index, a respected benchmark published by the Council for Community and Economic Research (C2ER) that provides a thorough overview of living expenses across different regions.
Rent data is provided by CoStar Group’s Market Trend reports. As the industry leader in commercial real estate information, analytics, and news, CoStar conducts extensive research to produce and maintain a comprehensive database of commercial real estate information. We combine this data with public record to provide the most up-to-date rental information available.
Consumer goods, services, and home prices are sourced from the Cost of Living Index published by the Council for Community and Economic Research (C2ER). The data on this page is updated quarterly. It was last published in June 2026.
Demographic information comes from Neustar and combines detailed address data with U.S. Census and American Community Survey statistics to produce reliable local estimates.


