Median Age
35 Years
Largest Age Group
20-29 Years
Approximately 20% of Residents
Under 20
23%
Over 65
18%


Avg Rent
$642
Population
40,015
Renter Mix
50% Rent
Cape Girardeau, also known as “Cape,” is the largest city in southeastern Missouri, stretching along the banks of the Mississippi River and the Missouri-Illinois border. Cape offers residents a country atmosphere with a taste of big-city living, from the national retailers at West Park Mall and the local shops in the quaint downtown area to the bustling Isle Casino Cape Girardeau and the many peaceful parks and green spaces in town.
Home to Southeast Missouri State University, Cape Girardeau exudes the vibrancy of a college town, with a bevy of shops, restaurants, bars, coffee houses, and entertainment venues. Destinations like Saint Louis and Memphis are about a two-hour drive away from Cape Girardeau as well. Convenience to I-55 makes getting around from Cape Girardeau simple.
Southeast Missouri State University is a prominent institution in Cape Girardeau.
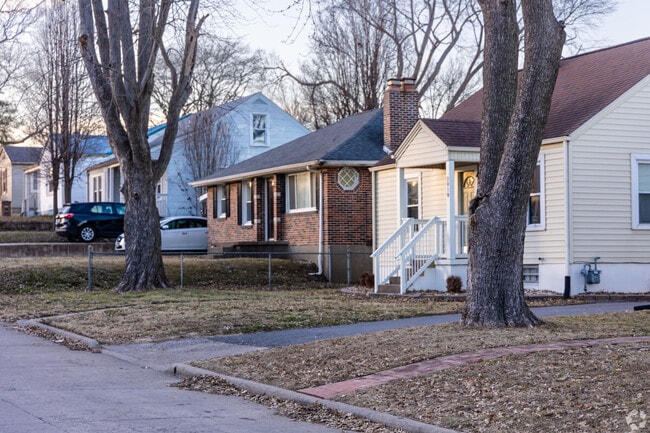
Bungalows and small cottages line streets in Cape Girardeau.
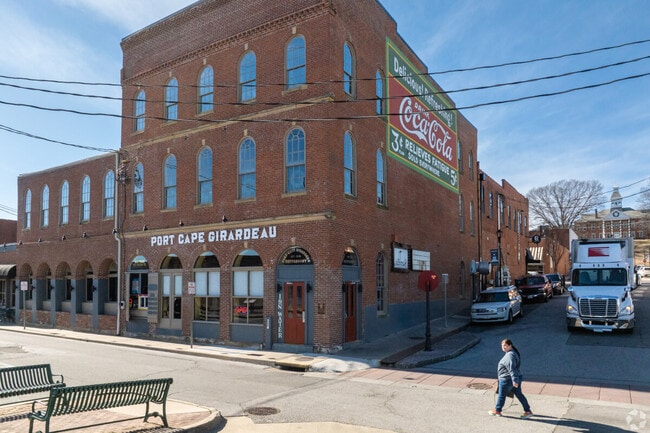
Restaurants and stores are located in historic buildings in Cape Girardeau.
Median Household Income
$49,268
Average: $67,314
Education
11,492
Residents Have a Degree
Job Market
19,646
Workers Employed
Median Age
35 Years
Largest Age Group
20-29 Years
Approximately 20% of Residents
Under 20
23%
Over 65
18%
Housing Distribution
In Cape Girardeau, there are roughly the same number of renters and homeowners.

Education Distribution
Review this city's overall education levels.

As of July 2026, the average apartment rent in Cape Girardeau, MO is $660 for a studio, $644 for one bedroom, $875 for two bedrooms, and $1,360 for three bedrooms. Apartment rent in Cape Girardeau has increased by 5.2% in the past year.
The cost of living in Cape Girardeau, MO is 5.4% lower than the national average. Generally, housing in Cape Girardeau is 18.2% less expensive than the national average, with rent falling between $644 - $1,360. You can expect to pay 5.2% more for groceries, 4.6% less for utilities, and 7.4% more for transportation.
Compare Cities
Explore how walkable, bikeable, drivable, and transit-friendly Cape Girardeau, MO is for everyday living.
Moderately Walkable
Walkability
Exceptionally Drivable
Drivability
Fairly Bikeable
Bikeability
Public
Grades PK-5
296 Students

Public
Grades PK-5
296 Students
Public
Grades PK-5
241 Students
Public
Grades PK-5
217 Students
Public
Grades K-5
623 Students

Public
Grades 6-8
633 Students

Public
Grades 6-8
618 Students
Nell Holcomb Elementary School
Public
Grades PK-8
244 Students

Public
Grades PK-8
244 Students
Public
Grades K-12
25 Students

Public
Grades 9-12
1,341 Students
Public
Grades 9-12
1,278 Students
Public
Grades K-12
25 Students
† Our analysis of utilities, groceries, transportation, healthcare, home prices, and other goods and services is sourced from the Cost of Living Index, a respected benchmark published by the Council for Community and Economic Research (C2ER) that provides a thorough overview of living expenses across different regions.
Rent data is provided by CoStar Group’s Market Trend reports. As the industry leader in commercial real estate information, analytics, and news, CoStar conducts extensive research to produce and maintain a comprehensive database of commercial real estate information. We combine this data with public record to provide the most up-to-date rental information available.
Consumer goods, services, and home prices are sourced from the Cost of Living Index published by the Council for Community and Economic Research (C2ER). The data on this page is updated quarterly. It was last published in June 2026.
Demographic information comes from Neustar and combines detailed address data with U.S. Census and American Community Survey statistics to produce reliable local estimates.


