Median Age
40 Years
Largest Age Group
15-24 Years
Approximately 14% of Residents
Under 20
25%
Over 65
18%


Avg Rent
$996
Population
36,850
Renter Mix
48% Rent
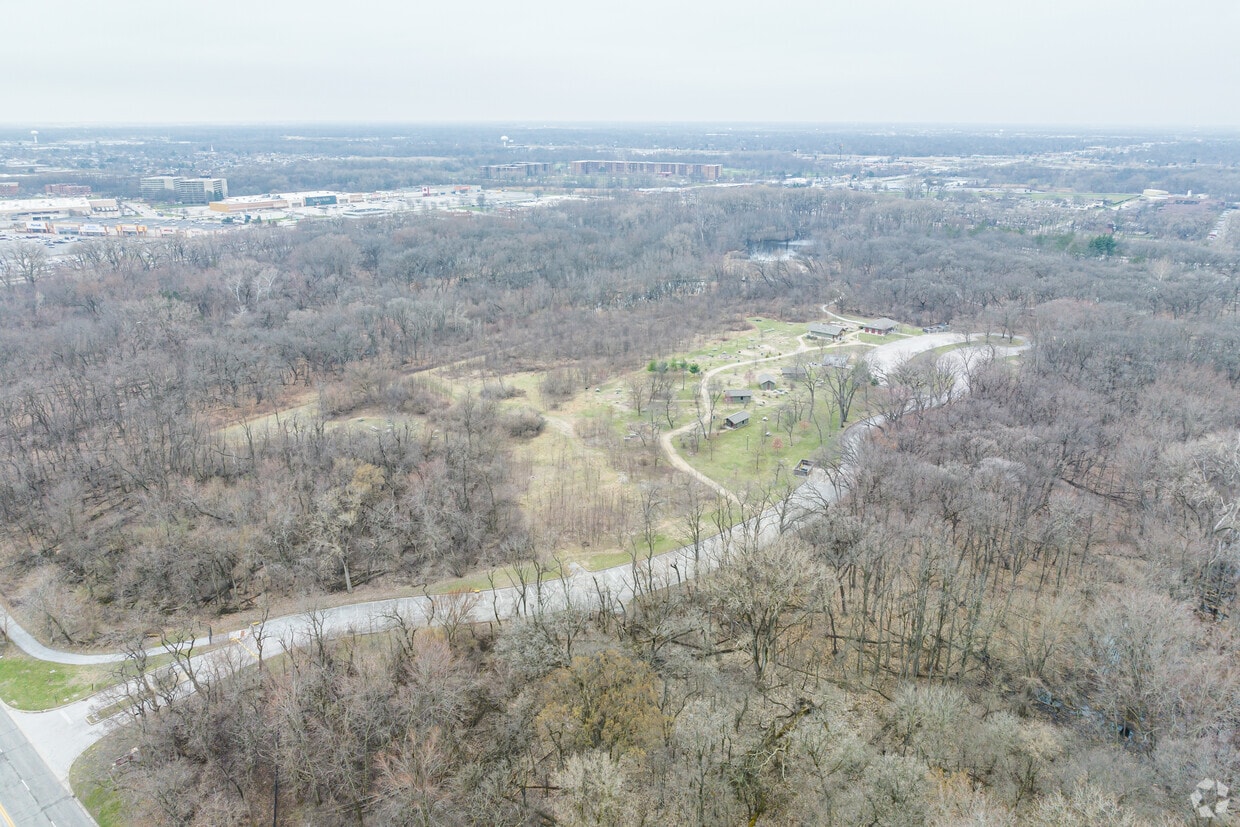
Calumet City sits about 23 miles south of Chicago along the Illinois-Indiana border, carrying a history that runs from its founding as West Hammond in 1893 to its reinvention as a primarily residential suburb. Locally known as Cal City, the community of roughly 36,000 spans just eight compact square miles, giving it a dense, neighborhood-centered feel without the sprawl of larger suburbs. Its location near Interstates 90, 94, and 294, along with Metra Electric line access at Hegewisch Station, keeps downtown Chicago within commuting range for those who work in the city but prefer a quieter address. River Oaks Center anchors retail activity in the southwest portion of the city, and the Burnham Greenway trail system threads through wetland and prairie corridors, connecting residents to neighboring Indiana towns on foot or by bike. The housing stock leans heavily toward garden-style apartment communities and two-flat rentals on tree-lined residential streets, with options that tend to be considerably more affordable than comparable units closer to the Chicago core. Sand Ridge Nature Center and a network of park district facilities round out the day-to-day lifestyle, making Cal City a practical, grounded choice for renters who want proximity to a major metro without the cost or congestion that comes with it.
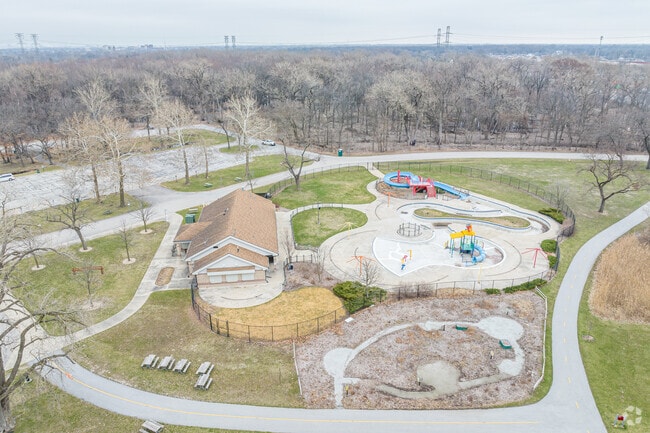
Green Lake Family Aquatic Center Sitting in Green Lake Woods
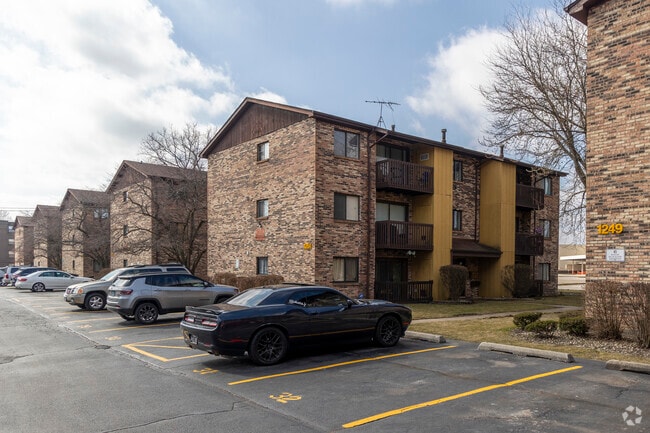
Condos are a popular home style in Calumet City.
The Sand Ridge Nature Center organizes programs open to Calumet City residents.
When it’s time to go shopping in Calumet City, River Oaks Center has retail favorites.
Residents of Calumet City can explore Chicago after a 20-mile drive on Interstate 94.
A beautiful street that showcases popular home styles of Calument City.
Median Household Income
$52,637
Average: $63,174
Education
6,008
Residents Have a Degree
Job Market
17,131
Workers Employed
Median Age
40 Years
Largest Age Group
15-24 Years
Approximately 14% of Residents
Under 20
25%
Over 65
18%
Housing Distribution
Calumet City has more homeowners than renters.

Education Distribution
Review this city's overall education levels.

As of August 2026, the average apartment rent in Calumet City, IL is $902 for a studio, $996 for one bedroom, $1,218 for two bedrooms, and $1,312 for three bedrooms. Apartment rent in Calumet City has increased by 2.9% in the past year.
Explore how walkable, bikeable, drivable, and transit-friendly Calumet City, IL is for everyday living.
Fairly Walkable
Walkability
Minimal Public Transit
Transit
Exceptionally Drivable
Drivability
Fairly Bikeable
Bikeability
Public
Grades PK-8
686 Students

Public
Grades PK-5
550 Students

Public
Grades K-5
303 Students
Public
Grades K-5
260 Students
Caroline Sibley Elementary School
Public
Grades K-5
422 Students

Public
Grades PK-8
686 Students
Public
Grades 6-8
291 Students

Public
Grades 6-8
235 Students

Public
Grades 6-8
266 Students
Creative Communications Academy
Public
Grades 6-8
237 Students
Thornton Fractional North High School
Public
Grades 9-12
1,265 Students
Center for Academics and Technology
Public
Grades 9-12

† Our analysis of utilities, groceries, transportation, healthcare, home prices, and other goods and services is sourced from the Cost of Living Index, a respected benchmark published by the Council for Community and Economic Research (C2ER) that provides a thorough overview of living expenses across different regions.
Rent data is provided by CoStar Group’s Market Trend reports. As the industry leader in commercial real estate information, analytics, and news, CoStar conducts extensive research to produce and maintain a comprehensive database of commercial real estate information. We combine this data with public record to provide the most up-to-date rental information available.
Consumer goods, services, and home prices are sourced from the Cost of Living Index published by the Council for Community and Economic Research (C2ER). The data on this page is updated quarterly. It was last published in June 2026.
Demographic information comes from Neustar and combines detailed address data with U.S. Census and American Community Survey statistics to produce reliable local estimates.


