Median Age
39 Years
Largest Age Group
30-39 Years
Approximately 16% of Residents
Under 20
23%
Over 65
18%
Avg Rent
$853
Population
14,334
Renter Mix
60% Rent
Butler, Pennsylvania sits about 30 miles north of Pittsburgh, giving it the rare combination of small-city character and straightforward access to a major metro area. Named after Continental Army General Richard Butler, the city carries deep manufacturing roots—it was here that the American Bantam Car Company helped develop the original Jeep, a legacy still celebrated each year through the Bantam Jeep Heritage Festival.
Today, Butler serves as the seat of Butler County and draws residents who want a grounded, community-oriented pace of life. The downtown area anchors the city with historic architecture alongside creative spaces where wall murals and local art installations reflect a growing cultural presence. Butler County Community College provides an educational anchor, keeping the area connected to workforce development. Surrounding neighborhoods range from walkable streets close to the city center to quieter residential pockets that offer more breathing room.
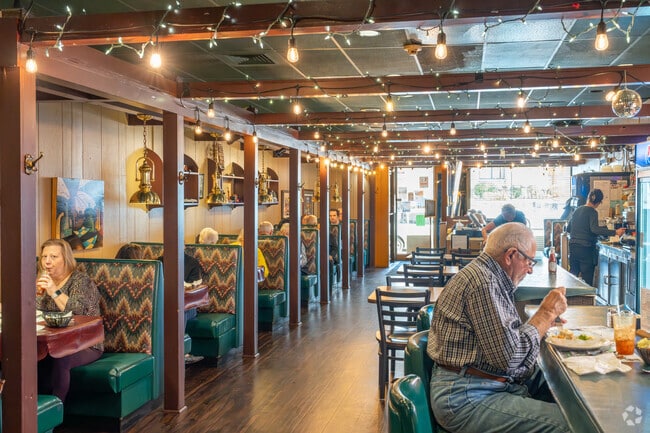
The neighbors in Butler always east at Natili North for an authentic Italian experience.
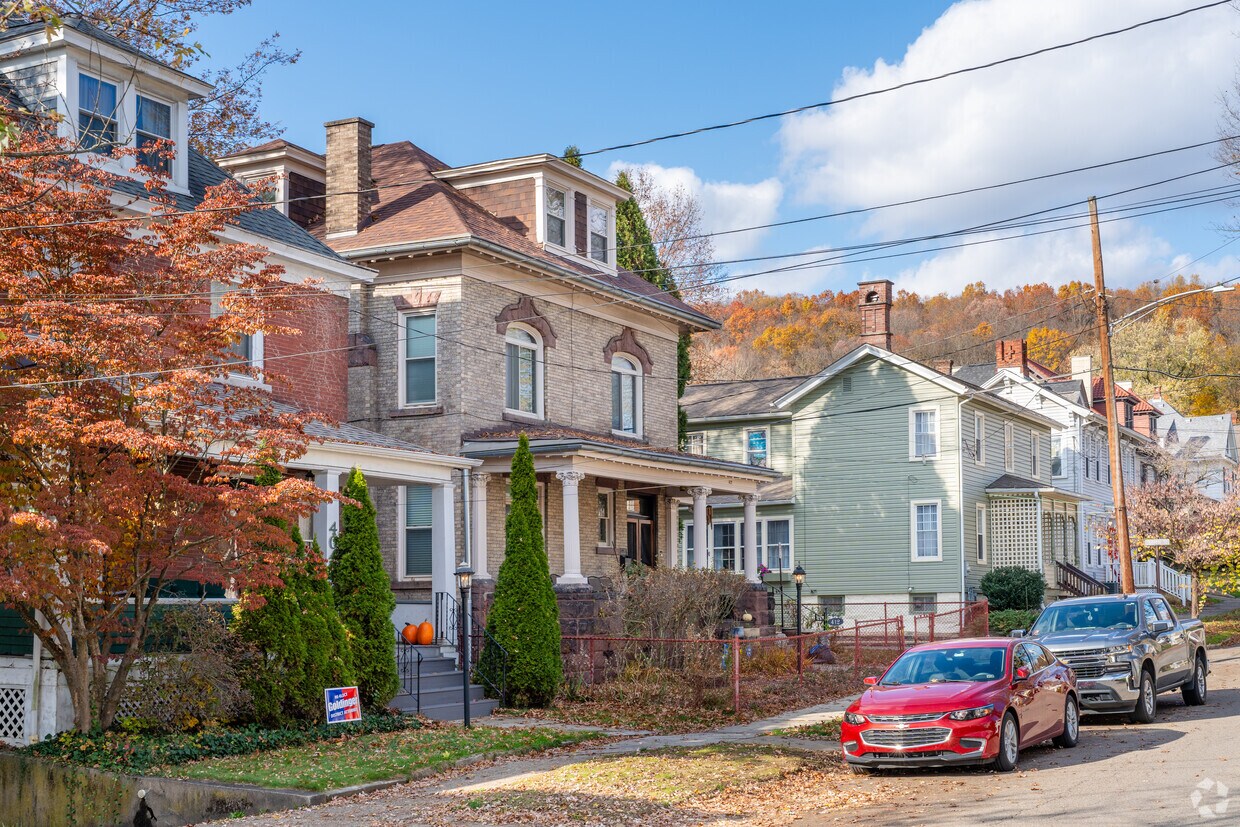
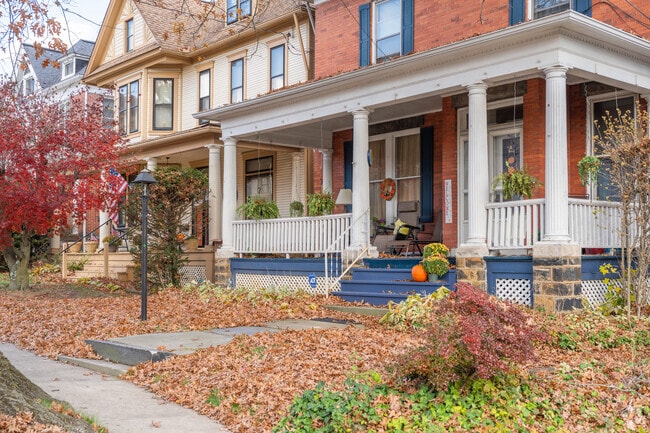
The cozy entrances to Traditional American homes have welcoming seasonal comfort.
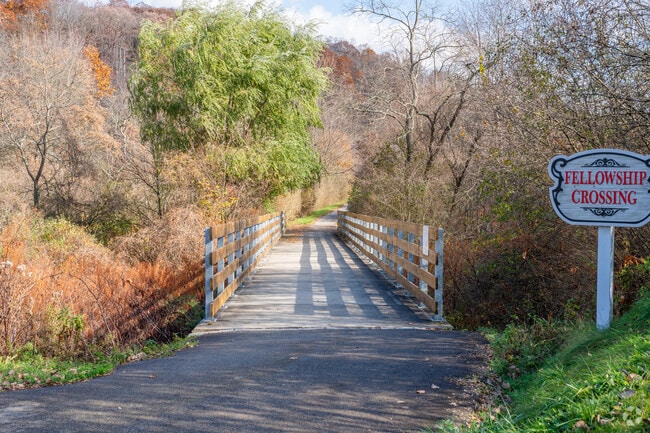
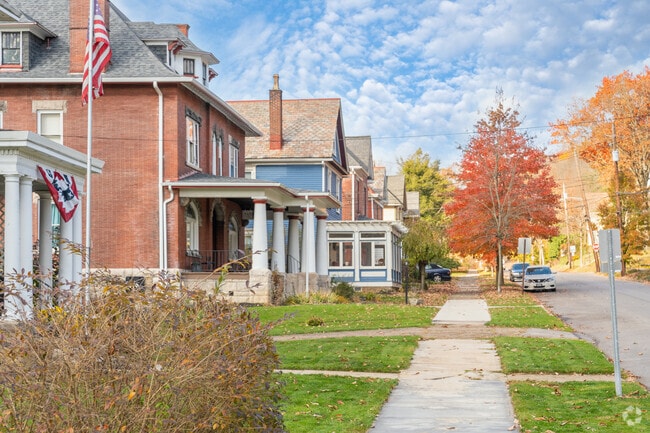
The sidewalks in Butler are peaceful and safe for walking families.
Catch one of the many bus routes in Butler to get around town.
The scene at Butler Brew Works is busy and full of memories.
Kids admire the purple playground at Almaeda Park and make memories in Butler.
Median Household Income
$35,701
Average: $53,442
Education
2,929
Residents Have a Degree
Job Market
6,397
Workers Employed
Median Age
39 Years
Largest Age Group
30-39 Years
Approximately 16% of Residents
Under 20
23%
Over 65
18%
Housing Distribution
Butler has more renters than homeowners.

Education Distribution
Review this city's overall education levels.

As of July 2026, the average apartment rent in Butler, PA is $820 for a studio, $853 for one bedroom, $1,024 for two bedrooms, and $1,610 for three bedrooms. Apartment rent in Butler has increased by 4.1% in the past year.
Explore how walkable, bikeable, drivable, and transit-friendly Butler, PA is for everyday living.
Moderately Walkable
Walkability
Moderately Drivable
Drivability
Moderately Bikeable
Bikeability
Public
Grades K-5
403 Students

Public
Grades K-5
584 Students

Public
Grades K-5
498 Students
Public
Grades K-5
259 Students

Public
Grades K-5
255 Students
Public
Grades 6-8
1,342 Students
Butler Area Intermediate High School
Public
Grades 6-8
1,291 Students
Butler Area Junior High School
Public
Grades 7-8
1,080 Students
Butler County Area Vocational-Technical School
Public
Grades 9-12
1,116 Students

Public
Grades 9-12
Butler Area Senior High School
Public
Grades 11-12
1,112 Students
† Our analysis of utilities, groceries, transportation, healthcare, home prices, and other goods and services is sourced from the Cost of Living Index, a respected benchmark published by the Council for Community and Economic Research (C2ER) that provides a thorough overview of living expenses across different regions.
Rent data is provided by CoStar Group’s Market Trend reports. As the industry leader in commercial real estate information, analytics, and news, CoStar conducts extensive research to produce and maintain a comprehensive database of commercial real estate information. We combine this data with public record to provide the most up-to-date rental information available.
Consumer goods, services, and home prices are sourced from the Cost of Living Index published by the Council for Community and Economic Research (C2ER). The data on this page is updated quarterly. It was last published in June 2026.
Demographic information comes from Neustar and combines detailed address data with U.S. Census and American Community Survey statistics to produce reliable local estimates.


