Median Age
39 Years
Largest Age Group
15-24 Years
Approximately 14% of Residents
Under 20
25%
Over 65
19%


Area Guide
Avg Rent
$1,164
Population
62,953
Renter Mix
46% Rent
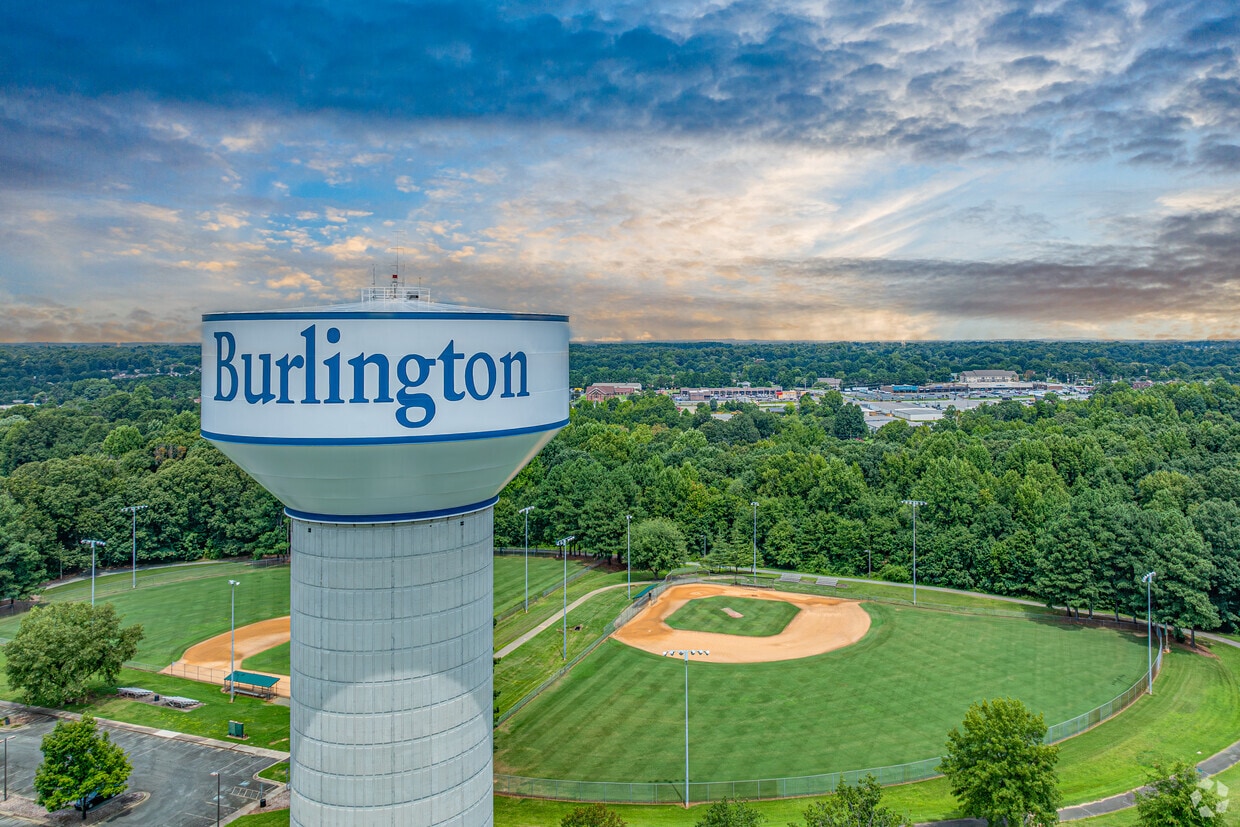
Welcome to Burlington, North Carolina, nestled in the Piedmont region. This historic community offers various rental options from apartments to historic homes. Currently, rental rates remain competitive, with one-bedroom units averaging $1,217 per month and two-bedroom homes at $1,369, showing modest year-over-year increases of 0.8% and 2.2% respectively. Notable areas include Downtown Burlington, with its preserved architecture and local businesses, and the West Davis Street-Fountain Place area, recognized for its historic character. At the center of community life stands Burlington City Park, home to a restored 1910 Dentzel Carousel listed on the National Historical Register, set within 75 acres of recreational space.
Burlington combines historical significance with contemporary amenities. The city serves as headquarters for Labcorp, a major employer in the region. Outdoor recreation opportunities abound along the Haw River Trail and throughout the city's park system. The restored Paramount Theater hosts performances year-round, contributing to the local arts scene. Burlington's heritage as a textile center began in 1908 with the establishment of Edwin M. Holt's cotton mill, though today the economy encompasses diverse industries. The city is home to both Elon University and Alamance Community College. Community traditions continue through events like the Burlington Carousel Festival, which celebrates the city's historic carousel each September.
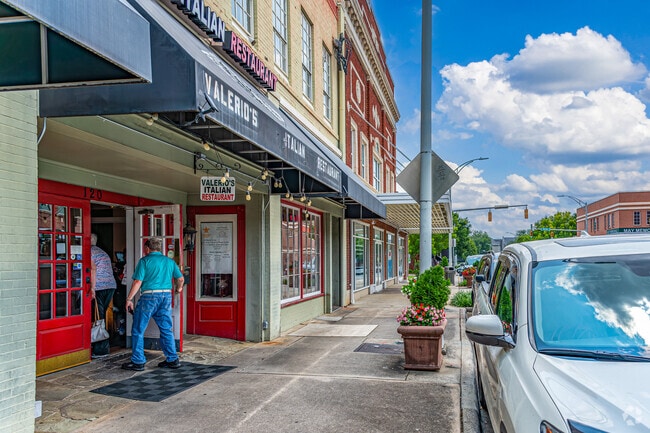
Folks adore the outdoor dining options in downtown.
Fishermen can cast a line from the banks at Red Slide Park.
Burlington residents love heading downtown for the many dining options.
Health-conscious residents head to Crush Superfoods in downtown Burlington.
There are many dining and shopping options in Downtown Burlington.
Readers head to Persnickety Books in Downtown Burlington.
Median Household Income
$52,479
Average: $68,566
Education
14,222
Residents Have a Degree
Job Market
31,159
Workers Employed
Median Age
39 Years
Largest Age Group
15-24 Years
Approximately 14% of Residents
Under 20
25%
Over 65
19%
Housing Distribution
Burlington has more homeowners than renters.

Education Distribution
Review this city's overall education levels.

As of July 2026, the average apartment rent in Burlington, NC is $858 for a studio, $1,170 for one bedroom, $1,314 for two bedrooms, and $1,562 for three bedrooms. Apartment rent in Burlington has increased by 1.1% in the past year.
The cost of living in Burlington, NC is 8.6% lower than the national average. Generally, housing in Burlington is 15.0% less expensive than the national average, with rent falling between $858 - $1,562. You can expect to pay 4.6% less for groceries, 8.9% less for utilities, and 5.6% less for transportation.
Compare Cities
Explore how walkable, bikeable, drivable, and transit-friendly Burlington, NC is for everyday living.
Moderately Walkable
Walkability
Limited Public Transit
Transit
Exceptionally Drivable
Drivability
Somewhat Bikeable
Bikeability
Public
Grades PK-5
481 Students

Public
Grades K-12
685 Students

Public
Grades K-5
514 Students
Public
Grades PK-5
439 Students
Public
Grades K-5
648 Students

Public
Grades 6-8
525 Students
Public
Grades K-12
685 Students
Public
Grades 6-8
736 Students

Public
Grades K-12
685 Students
Public
Grades 9-12
1,178 Students
Public
Grades 9-12
761 Students

† Our analysis of utilities, groceries, transportation, healthcare, home prices, and other goods and services is sourced from the Cost of Living Index, a respected benchmark published by the Council for Community and Economic Research (C2ER) that provides a thorough overview of living expenses across different regions.
Rent data is provided by CoStar Group’s Market Trend reports. As the industry leader in commercial real estate information, analytics, and news, CoStar conducts extensive research to produce and maintain a comprehensive database of commercial real estate information. We combine this data with public record to provide the most up-to-date rental information available.
Consumer goods, services, and home prices are sourced from the Cost of Living Index published by the Council for Community and Economic Research (C2ER). The data on this page is updated quarterly. It was last published in June 2026.
Demographic information comes from Neustar and combines detailed address data with U.S. Census and American Community Survey statistics to produce reliable local estimates.


