Median Age
33 Years
Largest Age Group
15-24 Years
Approximately 17% of Residents
Under 20
30%
Over 65
14%

Area Guide
Avg Rent
$916
Population
191,446
Renter Mix
39% Rent
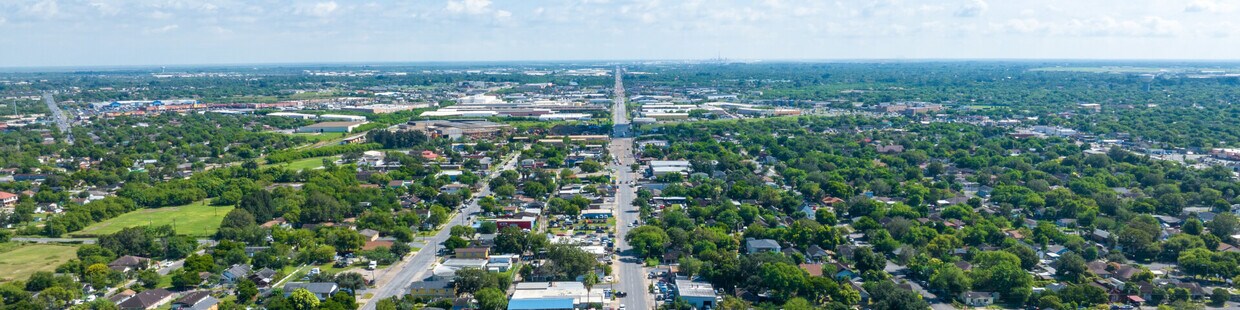
Situated at the southernmost tip of Texas, Brownsville combines American and Mexican cultures in a subtropical setting. This historic border city offers affordable living options, with average rents ranging from $625 for studios to $1,203 for three-bedroom units, showing modest year-over-year increases between 1.8% and 2.9%. The rental market includes options across established neighborhoods, from downtown apartments to communities near the University of Texas Rio Grande Valley. The city features 37 parks connected by 32 miles of bike lanes and 1,200 acres of parkland. At Resaca de la Palma State Park, residents can explore semitropical brushland and observe native wildlife along the park's trails.
Downtown Brownsville features preserved historic architecture, local art galleries, and cultural venues. The Port of Brownsville drives the region's international trade, while SpaceX's facility has brought aerospace development to the area. The University of Texas Rio Grande Valley enhances the city's educational opportunities. The annual Charro Days celebration brings together residents from Brownsville and Matamoros, Mexico for a traditional festival. South Padre Island's beaches are just a short drive away, and history buffs can explore Palo Alto Battlefield National Historical Park to learn about the area's role in Texas history.
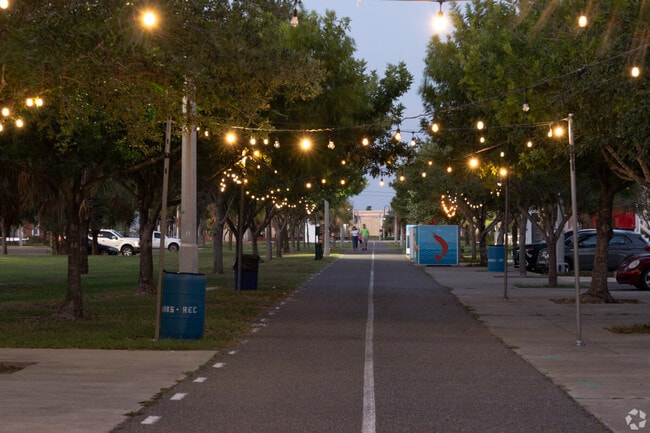
Strands of twinkle lights are draped over a street in Historic Brownsville.
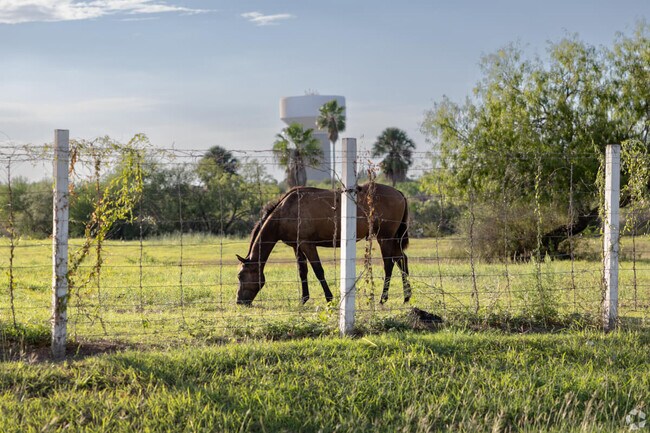
A horse grazes in a field in East Brownsville.
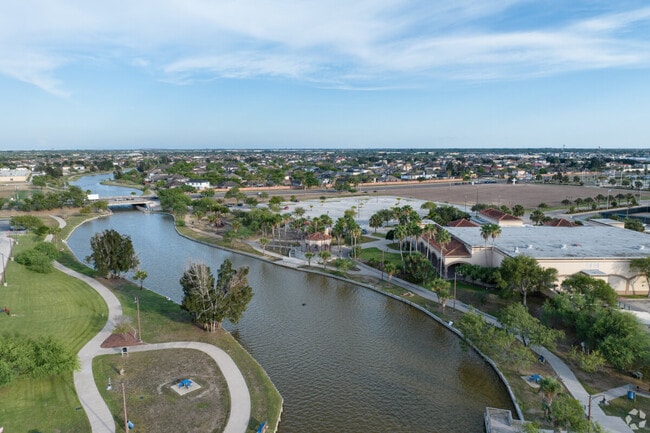
Brownsville residents can enjoy fishing and kayaking at the Brownsville Convention Center.
Median Household Income
$48,662
Average: $63,970
Education
29,767
Residents Have a Degree
Job Market
79,994
Workers Employed
Median Age
33 Years
Largest Age Group
15-24 Years
Approximately 17% of Residents
Under 20
30%
Over 65
14%
Housing Distribution
Brownsville has more homeowners than renters.

Education Distribution
Review this city's overall education levels.

As of July 2026, the average apartment rent in Brownsville, TX is $614 for a studio, $916 for one bedroom, $1,064 for two bedrooms, and $1,192 for three bedrooms. Apartment rent in Brownsville has increased by 2.4% in the past year.
The cost of living in Brownsville, TX is 14.6% lower than the national average. Generally, housing in Brownsville is 26.5% less expensive than the national average, with rent falling between $614 - $1,192. You can expect to pay 13.5% less for groceries, 22.3% less for utilities, and 3.4% more for transportation.
Compare Cities
Explore how walkable, bikeable, drivable, and transit-friendly Brownsville, TX is for everyday living.
Somewhat Walkable
Walkability
Exceptionally Drivable
Drivability
Fairly Bikeable
Bikeability
Public
Grades PK-5
798 Students

Public
Grades PK-5
882 Students

Public
Grades PK-5
841 Students
Public
Grades PK-5
749 Students
Rancho Verde Elementary School
Public
Grades PK-5
661 Students
IDEA Riverview College Preparatory
Public
Grades 6-12
813 Students

Public
Grades 6-8
1,095 Students

Public
Grades 6-8
964 Students
IDEA Brownsville College Preparatory
Public
Grades 6-12
783 Students
Public
Grades 6-8
976 Students

Brownsville Early College High School
Public
Grades 9-12
311 Students
IDEA Riverview College Preparatory
Public
Grades 6-12
813 Students
Public
Grades 9-12
2,172 Students
IDEA Brownsville College Preparatory
Public
Grades 6-12
783 Students
Public
Grades 9-12
1,621 Students
† Our analysis of utilities, groceries, transportation, healthcare, home prices, and other goods and services is sourced from the Cost of Living Index, a respected benchmark published by the Council for Community and Economic Research (C2ER) that provides a thorough overview of living expenses across different regions.
Rent data is provided by CoStar Group’s Market Trend reports. As the industry leader in commercial real estate information, analytics, and news, CoStar conducts extensive research to produce and maintain a comprehensive database of commercial real estate information. We combine this data with public record to provide the most up-to-date rental information available.
Consumer goods, services, and home prices are sourced from the Cost of Living Index published by the Council for Community and Economic Research (C2ER). The data on this page is updated quarterly. It was last published in June 2026.
Demographic information comes from Neustar and combines detailed address data with U.S. Census and American Community Survey statistics to produce reliable local estimates.


