Median Age
45 Years
Largest Age Group
60-69 Years
Approximately 15% of Residents
Under 20
21%
Over 65
24%
Area Guide
Avg Rent
$1,500
Population
11,245
Renter Mix
21% Rent
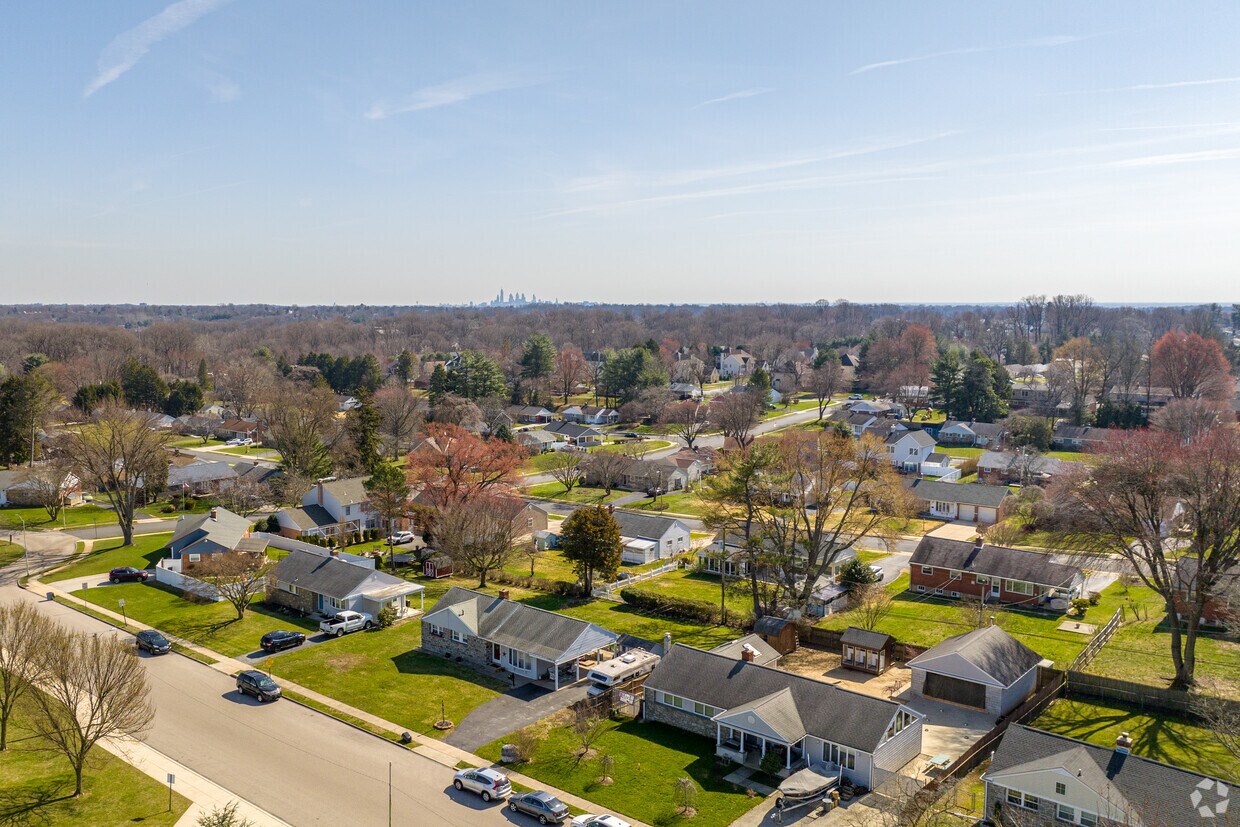
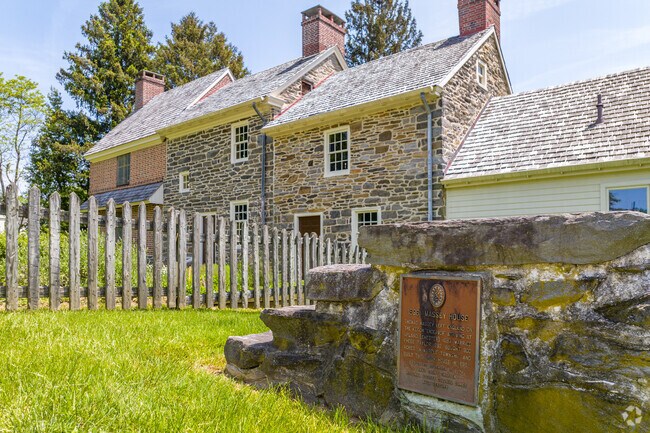
Tucked into Delaware County just west of Philadelphia, Broomall carries more than three centuries of history within its four square miles. This census-designated place sits inside Marple Township, and its roots run deep. The Thomas Massey House, built in 1696, still stands here and holds a spot on the National Register of Historic Places. Downtown Philadelphia is less than 20 miles away, making Broomall a practical base for anyone who wants a quieter pace without losing easy access to a major city.
Broomall's housing stock reflects its settled, suburban character. Renters will find a mix of apartment communities, townhomes, and garden-style units spread across a compact footprint. Options range from cozy one-bedroom layouts to more spacious multi-bedroom floor plans, and the overall scale stays low-rise and neighborhood-oriented rather than high-rise and urban. Delaware County Community College sits just a few miles away, adding an educational anchor to the area.
Day-to-day living in Broomall revolves around a well-established commercial corridor along Sproul Road, where shopping and services are close at hand. Surrounding communities like Havertown and Drexel Hill offer additional dining and entertainment options within a short drive. For those who appreciate history, local events, and a connected suburban setting, Broomall delivers a grounded, comfortable place to call home.
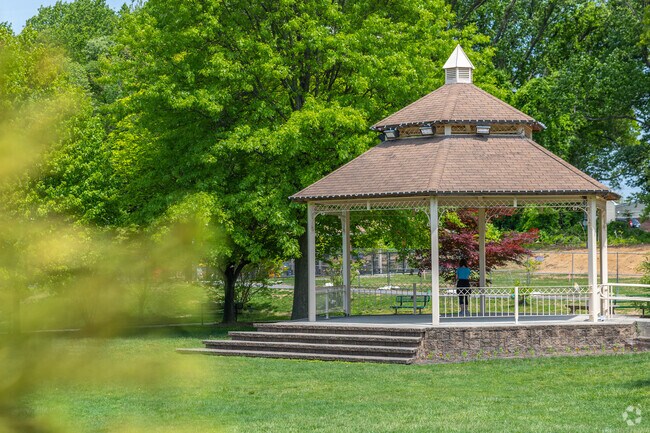
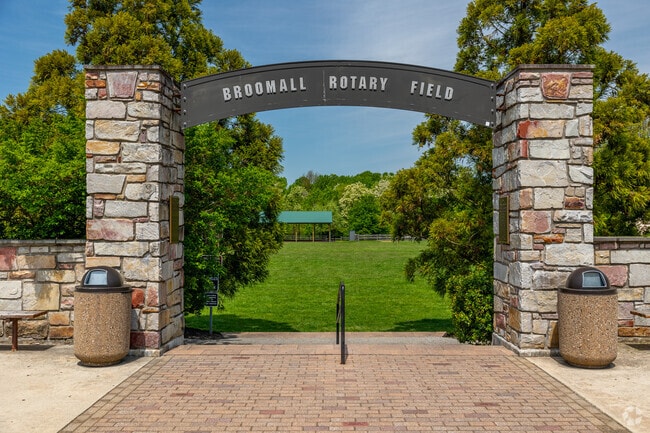
Play catch or just lounge in the sprawling Broomall Rotary Field in Broomalls' Veteran Park.
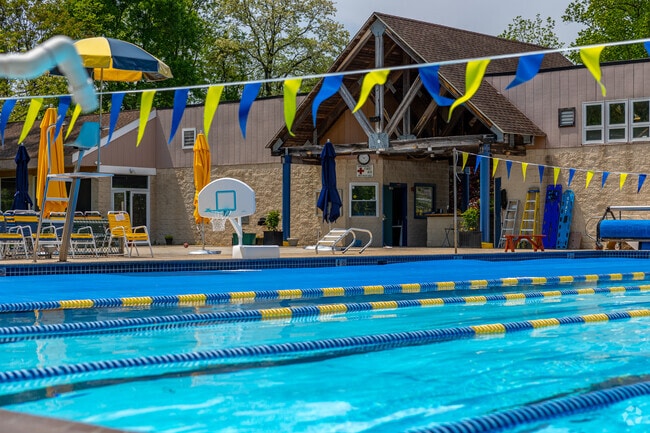
Cool off on a hot summer day in Broomall at Lawrence Park Swim Club.
Take in the history at the 1696 Massey House located in the heart of Broomall.
If you're looking for an authentic Philly cheesesteak, head to Thunderbird Steaks in Broomall.
A stream running through Kent Park provides wet fun for both kids and dogs.
Reach Center City, Philadelphia quickly from Broomall via major highways such as I-476.
Median Household Income
$108,671
Average: $130,133
Education
4,013
Residents Have a Degree
Job Market
6,028
Workers Employed
Median Age
45 Years
Largest Age Group
60-69 Years
Approximately 15% of Residents
Under 20
21%
Over 65
24%
Housing Distribution
Broomall has more homeowners than renters.

Education Distribution
Review this city's overall education levels.

As of June 2026, the average apartment rent in Broomall, PA is $1,500 for one bedroom, $1,744 for two bedrooms, and $2,193 for three bedrooms. Apartment rent in Broomall has increased by 2.4% in the past year.
Explore how walkable, bikeable, drivable, and transit-friendly Broomall, PA is for everyday living.
Fairly Walkable
Walkability
Limited Public Transit
Transit
Exceptionally Drivable
Drivability
Fairly Bikeable
Bikeability
Public
Grades K-5
393 Students

Public
Grades K-5
439 Students

Public
Grades K-5
363 Students
Public
Grades 6-8
853 Students

Delaware County Technical High School-Marple
Public
Grades 9-12

† Our analysis of utilities, groceries, transportation, healthcare, home prices, and other goods and services is sourced from the Cost of Living Index, a respected benchmark published by the Council for Community and Economic Research (C2ER) that provides a thorough overview of living expenses across different regions.
Rent data is provided by CoStar Group’s Market Trend reports. As the industry leader in commercial real estate information, analytics, and news, CoStar conducts extensive research to produce and maintain a comprehensive database of commercial real estate information. We combine this data with public record to provide the most up-to-date rental information available.
Consumer goods, services, and home prices are sourced from the Cost of Living Index published by the Council for Community and Economic Research (C2ER). The data on this page is updated quarterly. It was last published in June 2026.
Demographic information comes from Neustar and combines detailed address data with U.S. Census and American Community Survey statistics to produce reliable local estimates.


