Median Age
47 Years
Largest Age Group
50-59 Years
Approximately 15% of Residents
Under 20
23%
Over 65
25%

Bridgehampton earned its name from a bridge built across Sagg Pond in 1686, and that same sense of connection between land and water still defines life here today. Tucked into the South Fork of Long Island as part of the Town of Southampton, this small hamlet sits close to East Hampton and Sag Harbor, giving residents easy access to two of the Hamptons' most storied communities. Open horse farms, winding country lanes, and wide ocean beaches shape the everyday rhythm of the area. The Hampton Classic Horse Show draws visitors each summer, and the annual Mercedes-Benz Polo Challenge at the Bridgehampton Polo Club adds a distinctly local tradition to the calendar.
The housing stock here leans toward spacious single-family estates, classic shingled Hamptons cottages, and converted carriage-style homes. Apartment communities are less common than in denser metros, but renters can find a modest selection of smaller residential buildings and cottage-style rentals tucked among the larger properties. The low-density layout and sprawling green surroundings create a quieter, more spread-out pace compared to other parts of New York. Montauk Highway serves as the main corridor for everyday errands, keeping essentials close without disrupting the open, unhurried character that makes Bridgehampton one of the South Fork's most distinctive places to call home.
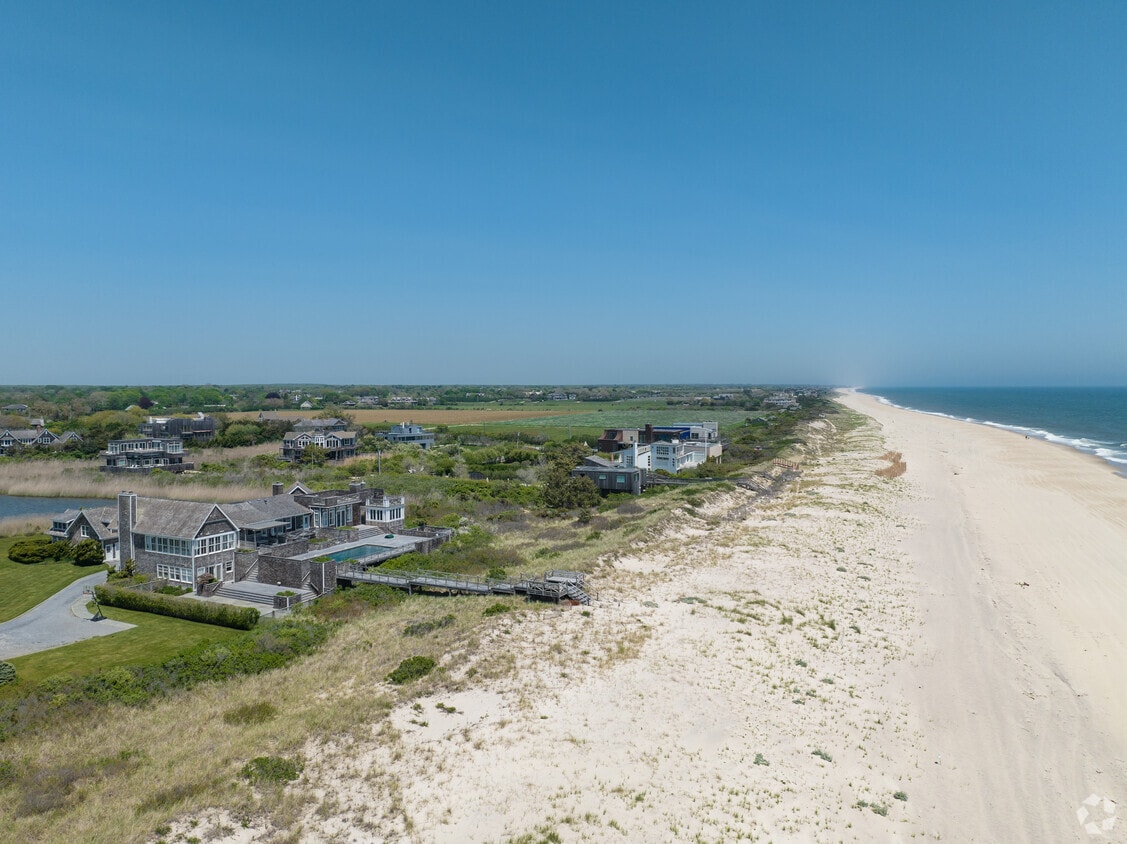
Local residents love to stroll down the peaceful beaches in Bridgehampton.
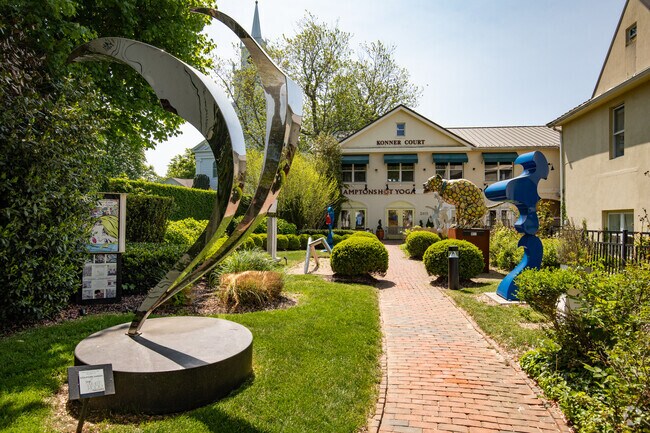
The Bridgehampton Sculpture Garden offers unique pieces among greenery.
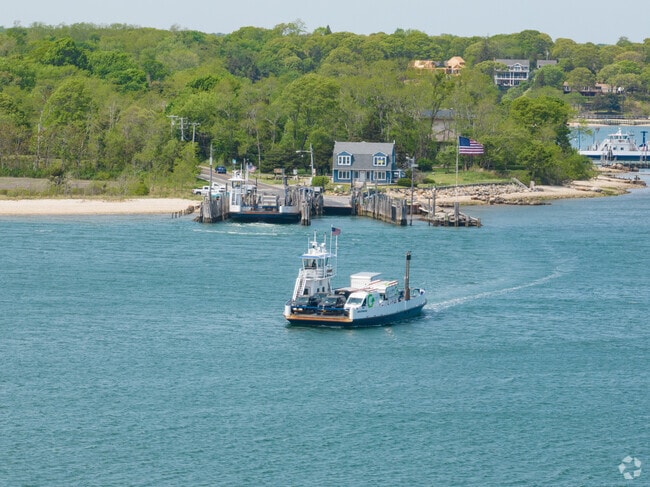
Shelter Island is a great getaway, only a short trip away from Bridgehampton's coast.
Bridgehampton offers quick ferry access for getaways to Shelter Island.
Bridgehampton has fantastic beaches you can enjoy.
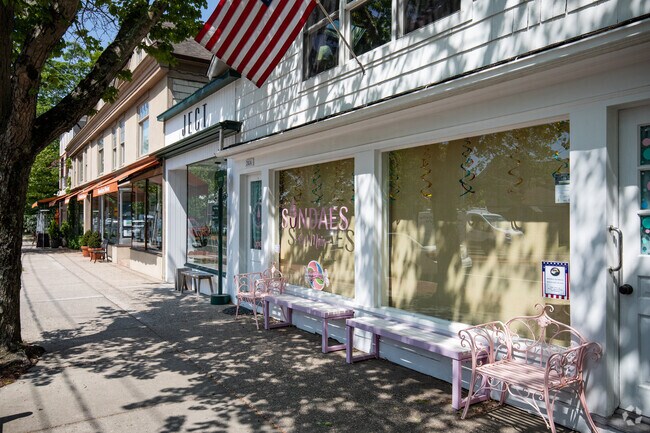
Bridgehampton's Main Street offers plenty of dining and shopping options.
Median Household Income
$137,500
Average: $167,772
Education
1,159
Residents Have a Degree
Job Market
1,202
Workers Employed
Median Age
47 Years
Largest Age Group
50-59 Years
Approximately 15% of Residents
Under 20
23%
Over 65
25%
Housing Distribution
Bridgehampton has more homeowners than renters.

Education Distribution
Review this city's overall education levels.

Explore how walkable, bikeable, drivable, and transit-friendly Bridgehampton, NY is for everyday living.
Fairly Walkable
Walkability
Some Public Transit
Transit
Exceptionally Drivable
Drivability
Fairly Bikeable
Bikeability
Public
Grades PK-12
183 Students

Public
Grades PK-12
183 Students
Public
Grades PK-12
183 Students
† Our analysis of utilities, groceries, transportation, healthcare, home prices, and other goods and services is sourced from the Cost of Living Index, a respected benchmark published by the Council for Community and Economic Research (C2ER) that provides a thorough overview of living expenses across different regions.
Rent data is provided by CoStar Group’s Market Trend reports. As the industry leader in commercial real estate information, analytics, and news, CoStar conducts extensive research to produce and maintain a comprehensive database of commercial real estate information. We combine this data with public record to provide the most up-to-date rental information available.
Consumer goods, services, and home prices are sourced from the Cost of Living Index published by the Council for Community and Economic Research (C2ER). The data on this page is updated quarterly. It was last published in June 2026.
Demographic information comes from Neustar and combines detailed address data with U.S. Census and American Community Survey statistics to produce reliable local estimates.


